Personal Wealth Management / Market Analysis
Stocks and the Fed’s Shrinking Balance Sheet
Markets seem to be quietly proving “quantitative tightening” isn’t bearish.

$7.6 trillion.[i] At that size, the Fed’s balance sheet isn’t exactly small. But it is smaller, having fallen -$1.4 trillion since peaking in April 2022. This process, known as quantitative tightening (QT), is the reverse of the Fed’s quantitative easing (QE) bond buying. The Fed lets assets it amassed (mainly Treasurys) mature, shrinking its balance sheet. As the “tightening” in the name implies, many believe QT is, like rate hikes, restrictive monetary policy—and, like rate hikes, many say it is bearish. But recent history suggests otherwise.
America’s forays into QE started in November 2008. With short-term rates already cut to zero by then to combat the financial crisis, the Fed launched a program aimed at stimulating credit creation by lowering long-term interest rates. To do this, it hoovered up long-term Treasurys and mortgage-backed securities. Buying bonds en masse boosts their prices, which move opposite their yields. And lower yields, the thinking goes, encourage borrowing. They also allegedly push investors into potentially higher-returning-though-riskier assets like stocks. While this first QE iteration ended in the late 2010s—with QT commencing in 2018—the Fed fired QE back up in March 2020, roughly doubling its balance sheet again in two years.
But after inflation jumped in late 2021 and early 2022, the Fed did a sharp 180, starting a cycle of rate hikes—and embarking on QT once more. Officials first hinted at this in minutes released in April 2022. They officially followed through that June. Many warned QT would cause markets to crater. This would only add pressure to things like war, sanctions, ongoing inflation, supply chain issues and soaring energy prices months into what turned out to be 2022’s shallow bear market.
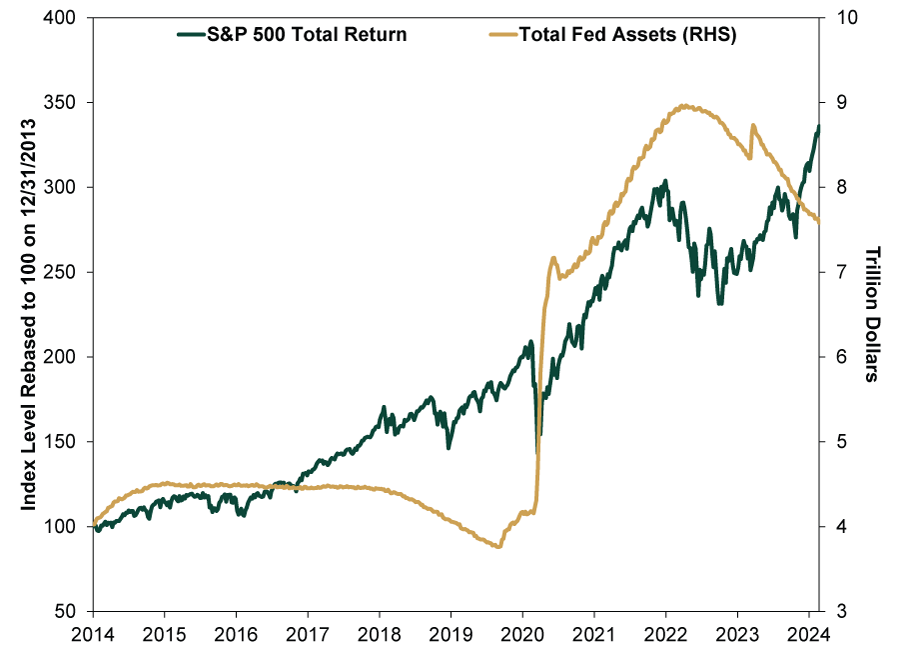
As Exhibit 1 shows, though, stocks troughed in October 2022 while the Fed’s balance sheet kept shrinking and—after a brief (regional bank-run-related) jump last March—has steadily declined since. This resembles QT’s last 2018 – 2019 go ’round. At that time, pundits also assumed a QT-led stock derailment would ensue. And Q4 2018 did see a large correction. But the correction started well after QT began—and stocks had resumed rising well before the Fed’s balance-sheet shrinking stopped. So although a significant pullback occurred during that round of QT, it seems like a coincidence to us—correlation without causation.
Exhibit 1: QT Doesn’t Deter Stocks
Source: FactSet, as of 2/29/2024.
This brings us to the underlying reason why QT has failed to tank stocks: It presumes low rates are needed for them to rise—but that isn’t so. In the high-and-rising rate 1970s, history shows no identifiable relationship between long rates and stocks. Rates rose three percentage points between October 1982 and June 1984—early in the 1982 – 1987 bull market, among other examples.[ii] So it shouldn’t shock that stocks have hit record levels lately while the fed funds rate stands at more than two-decade highs and 10-year Treasury yields hover at levels last seen 17 years ago.
Today, people still talk about QT as though it is an issue, speculating its end, like rate hikes, is uber bullish. But they gloss over the part where QT was never bearish to begin with—echoing rate hikes. In any event, it may be the Fed doesn’t unwind every asset purchased and that QT’s end will come soon. But speculation over this is needless. Markets already showed you QT fear is false.
If you would like to contact the editors responsible for this article, please message MarketMinder directly.
*The content contained in this article represents only the opinions and viewpoints of the Fisher Investments editorial staff.
Get a weekly roundup of our market insights
Sign up for our weekly e-mail newsletter.

You Imagine Your Future. We Help You Get There.
Are you ready to start your journey to a better financial future?

Where Might the Market Go Next?
Confidently tackle the market’s ups and downs with independent research and analysis that tells you where we think stocks are headed—and why.
Related Resources
-
Weekly Wrap-Up Fisher Investments Reviews: Last Week in Markets—July 6 - July 102026-07-13
-
Expert Commentary 3 Things You Need to Know This Week | US Inflation, China GDP, US Retail Sales
 2026-07-13
 -
Expert Commentary This Week in Review | Global PMIs, SpaceX, RMD Planning
 2026-07-10
 -
Market Analysis Trim Your Angst on Economic Measurement Tweaks2026-07-09


Learn More
Learn why 210,000 clients trust us to manage their money and how Fisher Investments and its affiliates may be able to help you achieve your financial goals.
As of 6/30/2026
New to Fisher? Call Us.
Contact Us Today