Personal Wealth Management / Economics
Who Keeps Snapping Up US Debt?
Demand for US Treasury Bonds is broad-based.

Among the many talking points surrounding the ongoing debt ceiling debate is a simple question: If the US keeps adding debt, won’t we run out of buyers? Where is all the demand going to come from? While no one can know what the future holds precisely, recent history can be instructive—and perhaps put one of investors’ debt fears to bed for the time being.
The recent history we refer to is the approximately $5.1 trillion added to net public debt since the end of 2019—all the bonds issued to fund COVID relief and other spending.[i] This is the largest, fastest increase outside of wartime, and during the middle of a global economic crisis to boot. Yet that didn’t deter Treasury demand. Buyers abounded, and that robust demand is a big reason why 10-year US Treasury yields are lower today than they were at 2019’s end.
Exhibit 1 details this demand, showing the increase in major owners’ holdings of US debt between December 2019 and July 2021—the latest month for which the Treasury has published information on international owners. As it shows, demand was broad-based.
Exhibit 1: Major Investors’ Increase in US Treasury Holdings (USD Billions), 12/31/2019 – 7/31/2021
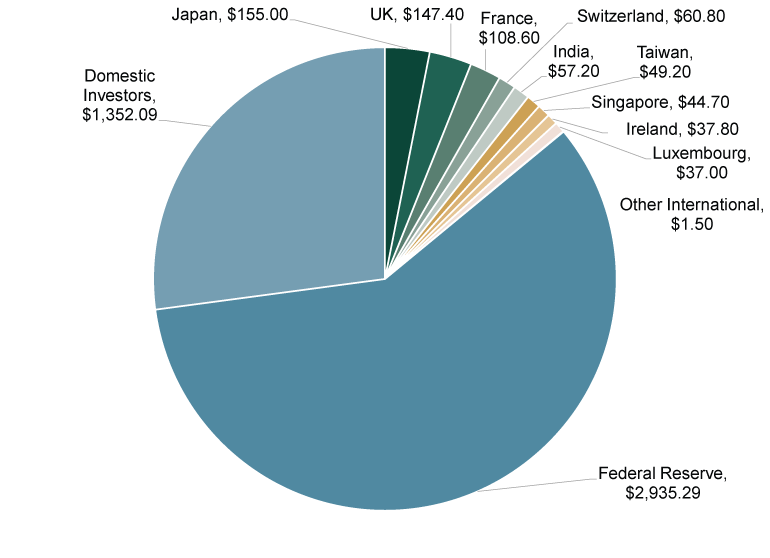
Source: Federal Reserve and US Treasury, as of 10/6/2021. “Other International” refers to the net change in all other countries’ holdings.
Interestingly, China, the US’s second-largest international creditor after Japan, is absent from this chart. There is a simple reason for this: China’s US Treasury holdings fell by $1.6 billion over this stretch, shattering the long-running myth that China is propping up America’s debt.[ii] Demand is much, much broader.
The Fed’s huge role in Treasury markets over this period has raised plenty of eyebrows. Some argue the Fed is effectively financing Treasury debt, putting modern monetary theory in action. Others worry that as the Fed “tapers” and eventually ends its quantitative easing (QE) bond purchases, the Treasury’s chickens will finally come home to roost—without the biggest buyer over the past 21 months, surely now demand will crater.
But we also have a historical counterpoint for this theory, courtesy of the five-plus year stretch between the end of the Fed’s post-financial-crisis QE and the end of 2019. Net public debt rose $4.3 trillion during that stretch, while the Fed’s holdings decreased. China slashed its holdings by $174.4 billion during this period.[iii] But there were oodles of international and domestic investors to fill the shortfall, as Exhibit 2 shows. That is a big reason why the average interest rate on marketable US debt rose incrementally over these five-plus years, from 2.016% in October 2014 to just 2.360% in December 2019.[iv] (For those curious, it was all the way down to 1.470% in September 2021, the latest figure available.[v]) Does that seem too low to attract investors? Just look globally. Rates are negative across much of Europe and Japan.
Exhibit 2: Major Investors’ Increase in US Treasury Holdings (USD Billions), 10/31/2014 – 12/31/2019
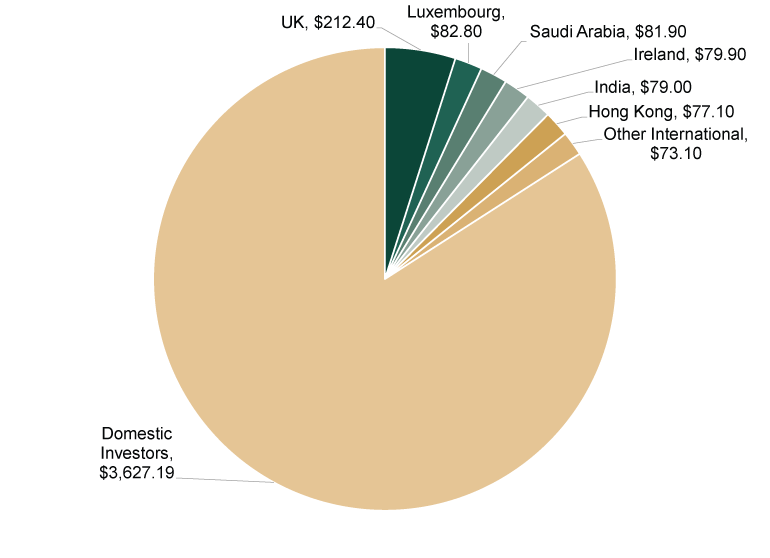
Source: US Treasury, as of 10/6/2021. “Other International” refers to the net change in all other countries’ holdings.
If this history is a guide, it seems fair to say the demand for US Treasurys is highly likely to come from American and international investors. Maybe some international central banks and sovereign wealth funds. Probably some international banks, pension funds, insurers, fund managers and other institutional investors. Quite likely some American banks, pension funds, insurers, mutual funds, index funds and retail investors. People and institutions who want or need to own stable assets with high liquidity and low volatility have a strong tendency to flock to the world’s deepest, most liquid government asset—an IOU from Uncle Sam. Judging from late-September’s Treasury auctions, which were oversubscribed, debt ceiling bickering and Fed taper talk haven’t dented that demand in any meaningful way. We doubt that changes in the foreseeable future.
If you would like to contact the editors responsible for this article, please message MarketMinder directly.
*The content contained in this article represents only the opinions and viewpoints of the Fisher Investments editorial staff.
Get a weekly roundup of our market insights
Sign up for our weekly e-mail newsletter.

You Imagine Your Future. We Help You Get There.
Are you ready to start your journey to a better financial future?

Where Might the Market Go Next?
Confidently tackle the market’s ups and downs with independent research and analysis that tells you where we think stocks are headed—and why.
Related Resources
-
Market Analysis The New Tariffs in Town Are Still Old News2026-07-24
-
Expert Commentary This Week in Review | Market Volatility, Tariffs, SpaceX
 2026-07-24
 -
Economics A Summertime Check-in on US Consumers2026-07-23
-
Expert Commentary Why Ken Fisher Is Optimistic About European Stocks
 2026-07-23


Learn More
Learn why 210,000 clients trust us to manage their money and how Fisher Investments and its affiliates may be able to help you achieve your financial goals.
As of 6/30/2026
New to Fisher? Call Us.
Contact Us Today