Personal Wealth Management / Market Analysis
A Loose Check-In on Supply and Demand in the US Economy
Retail sales and industrial production offer some loose hints.

Hot on China’s heels, the US released two major economic data points on Tuesday: April retail sales and industrial production. The former garnered the most attention, with several outlets portraying retail sales’ 0.9% m/m rise—and an upward revision to March’s results—as a sign consumers remain resilient in the face of inflation.[i] While we appreciate the optimism, we wouldn’t read that far into the report—and we found far more noteworthy developments in the industrial production report. Both are backward-looking for stocks, but we think understanding the nitty gritty can help investors put the latest headlines in context—and they yield hints about recent trends on the demand and supply side of America’s economy.
What Retail Sales Do—and Don’t—Show
As we explained last month, retail sales aren’t hugely telling about how inflation is affecting demand for a simple reason: The monthly data aren’t inflation-adjusted. The Census Bureau reports the amount spent across a range of stores, and it applies seasonal adjustments, but it doesn’t report the quantity of goods sold. Therefore, until the Bureau of Economic Analysis’s personal consumption expenditures report hits just before month-end, we don’t have a great read on things.
For instance: Sales at gas stations fell -2.7% m/m, which detracted from headline retail sales growth (excluding gas stations, sales rose 1.3%).[ii] Does this mean high gas prices inspired people to drive less so they could spend more on food or discretionary purchases? Or is the drop simply because national average gas prices fell in April? We suspect it was some combination of the two, but about the only forward-looking takeaway is that, given gas prices are on the rise again this month, this probably isn’t the last data distortion we will see.
We see similar questions as we look up and down the data report. Food and beverage stores’ sales fell -0.2% m/m.[iii] Did soaring grocery costs cause people to make tough choices? Or did people continue the post-pandemic return to restaurants, whose sales rose 2.0%?[iv] What about the 2.2% rise in car sales, which followed March’s -2.4% decline?[v] Is it a sign supply is catching up with demand, or is it a figment of rising new car prices, which last week’s CPI report estimated jumped 1.7% m/m in April?[vi]
Look, we think US economic drivers are healthy, and we think stocks are primed to rebound as this year’s early uncertainties gradually ease. But we don’t think this—or really any—retail sales report proves the point. In addition to retail sales’ being backward-looking and not inflation-adjusted, spending on goods represents just under 35% of total consumer spending.[vii] The vast majority goes to services, which have experienced a much slower inflation than goods. So while it is encouraging to see total retail sales rose faster than the Bureau of Labor Statistics estimated goods prices rose in the month, that amounts to at best a fuzzy guess about one-third or so of total consumer spending.
Lots to Like in Industrial Production
Like retail sales, the industrial production report is backward-looking. But unlike retail sales, it is inflation-adjusted—an index measuring the volume of output. So, that 1.1% m/m jump in industrial production is pure increased output, with no price skew.[viii] Ditto manufacturing’s 0.8% rise, which includes a 5.7% increase in production of motor vehicles on top of March’s 13.5% surge.[ix] Seems to us that high car prices are incentivizing US auto factories to ramp up to meet demand. Note that this comes despite rising component costs—and it also suggests component supply bottlenecks, like the widely publicized semiconductor shortage, are easing.
A similar phenomenon is playing out in the US energy industry. Oil and gas well drilling rose 3.2% m/m, extending its rapid growth streak to seven months and putting the year-over-year increase in activity at 54.3%.[x] As Exhibit 1 shows, drilling activity is nearly back at pre-lockdown levels. While new wells take time to translate to higher oil and gasoline supply, the industry is responding to high oil and gasoline prices. Higher supply is coming, which should eventually help ease the pain at the pump.
Exhibit 1: Oil Drilling Is Back
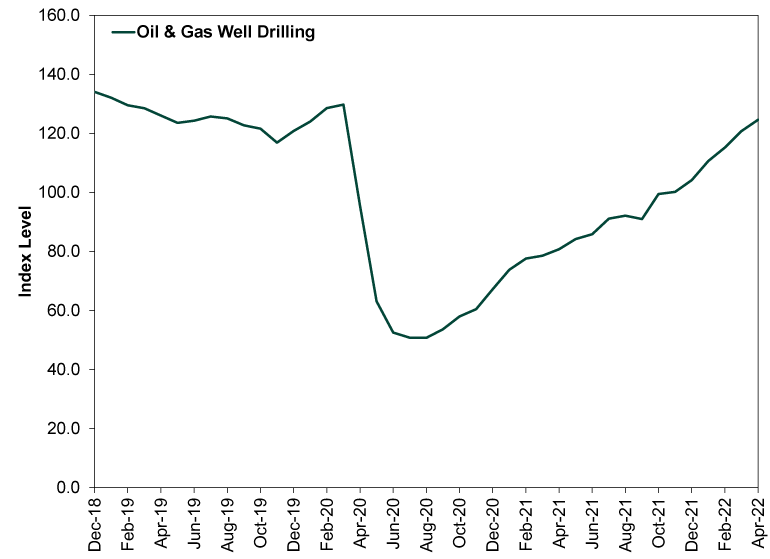
Source: FactSet, as of 5/17/2022. Monthly oil & gas well drilling, December 2018 – April 2022.
Overall, we think industrial production’s ongoing strength augurs well for inflation. When prices rise on supply shortages, it generally takes supply increases to ease the pain, unless demand falls off a cliff. What these twin reports show, in concert, is output rising amid at least some loose signs demand is holding firm. That increased output may not show up immediately in CPI, and we aren’t saying prices will fall across the board. But as supply catches up with demand, it should help prices stabilize or rise more slowly off a higher base, reducing the inflation rate to a much more manageable pace. The more this dawns on investors, the more it should help this year’s early uncertainty ease, helping markets move past the fear and resume weighing fundamentals over the next 3 – 30 months.
If you would like to contact the editors responsible for this article, please message MarketMinder directly.
*The content contained in this article represents only the opinions and viewpoints of the Fisher Investments editorial staff.
Get a weekly roundup of our market insights
Sign up for our weekly e-mail newsletter.

You Imagine Your Future. We Help You Get There.
Are you ready to start your journey to a better financial future?

Where Might the Market Go Next?
Confidently tackle the market’s ups and downs with independent research and analysis that tells you where we think stocks are headed—and why.
Related Resources
-
Expert Commentary This Week in Review | Fed Meeting, US GDP, Eurozone GDP
 2026-07-31
 -
Economics Q2 US GDP’s Stealthy Strength2026-07-31
-
Market Analysis Don’t Fret the EU’s Low Summertime Gas Storage Levels2026-07-31
-
Economics On Fires and GDP2026-07-30


Learn More
Learn why 210,000 clients trust us to manage their money and how Fisher Investments and its affiliates may be able to help you achieve your financial goals.
As of 6/30/2026
New to Fisher? Call Us.
Contact Us Today