Personal Wealth Management / Market Analysis
All-Time Highs … and Still Undervalued?
Stocks don’t need gangbusters economic growth in order to keep marching higher.


Stocks likely see plenty more all-time highs as investors bid up firms with the most stable earnings growth during the bull market’s latter stages. Photo by Spencer Platt/Getty Images.
With market indexes globally marching past cyclical or all-time highs in recent weeks, many folks have suggested stocks are somehow disconnected from economic fundamentals—that a rip-roaring stock rally amid just ok-ish economic growth can't last, and stocks must come back to earth.
Considering GDP’s at all-time highs and growing in the US and, on balance, globally, we rather disagree stocks are detached from reality. Then again, stocks needn’t move in tandem with GDP—equities aren’t directly tied to economic growth. Rather, they’re slices of ownership in publicly traded firms. And here, in our view, there is a disconnect—the good kind. There’s strong evidence markets don’t yet appreciate how strong firms are. As investor sentiment catches up with reality, stocks should keep rising.
The relationship between stocks and corporate profits shows this nicely (Exhibit 1). During the first legs of the 1990-2000 and 2002-2007 bull markets, stocks and corporate profits grew neck and neck. Stocks shot away from earnings during the more mature stages before eventually falling back to reach parity. During this bull market, however, stocks have lagged profits, which suggests investors aren’t quite hip to the underlying strength of corporate America.
Exhibit 1: Corporate Profits and S&P 500 Price, Indexed to 100 on 1/1/1990
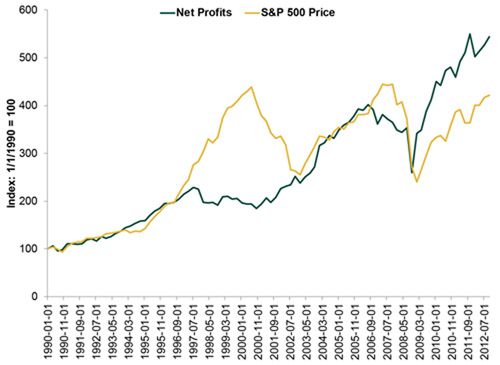
Source: St. Louis Federal Reserve, as of 04/01/2013. Corporate Profits After Tax With Inventory Valuation Adjustment and Capital Consumption Adjustment, Billions of Dollars, Quarterly, Seasonally Adjusted Annual Rate and S&P 500 Price Index, 1/1/1990 – 12/31/2012.
Equity valuations tell a similar story. According to Bloomberg, this bull market’s average annualized return about matches the last 50 months of the 1990-2000 bull market. Yet valuations are much lower—18.6 for today’s 12-month trailing S&P 500 P/E ratio, compared to 25.7 at the tech bubble’s height, as this bull market hasn’t yet seen the period of multiple expansion typical of mature bulls. In most of the bull markets since 1932, the S&P 500’s 12-month trailing P/E has risen at the beginning, fallen off through the middle then shot up toward the end, for an average gain of 58.6% over the entire bull (72.4% if you exclude the truncated 2002-2007 bull).
In this bull, we’ve seen a somewhat odder trajectory so far. The P/E was off the chart (literally—Exhibit 2) for the first nine months as stocks recovered before earnings resumed growing. It reached more normal levels by January 2010, then continued falling until September 2011. Since then, it’s only risen 38%.
Exhibit 2: S&P 500 12-Month Trailing P/E (Level and Y/Y Change)
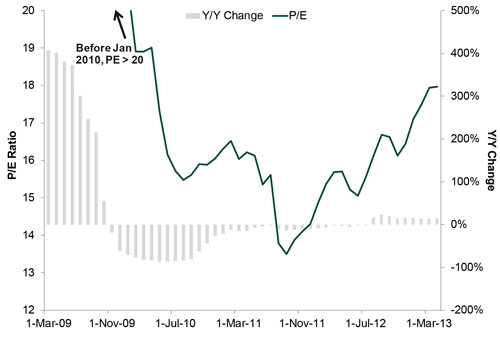
Source: https://www.multpl.com/s-p-500-pe-ratio, Thomson Reuters, as of 4/30/2013.
For P/Es to match their average bull market rise, stocks could rise significantly, or earnings could fall (or some combination of the two). In our view, rising stocks seems more likely—there doesn’t appear to be a catalyst for very weak earnings looking ahead. Earnings growth has slowed in recent quarters, which is typical as year-over-year comparisons get tougher when earnings are at all-time highs and rising, but many firms are finding ways to plough forward. Outside of the very cyclical Materials, Industrials and Energy sectors, top-line revenues are growing—and all-time-high-and-rising domestic demand augurs well for higher sales from here. Firms are also buying back stock, giving earnings-per-share an easy boost. And not an artificial boost—it makes financial sense for firms to do this. With corporate bond yields at historic lows and below equity earnings yields, firms can borrow cheaply, (likely) earn a higher return on purchased shares and pocket the spread. That should keep balance sheets healthy and allow businesses to continue investing without spending down cash reserves—supporting future growth.
Of course, earnings growth likely won’t be uniform across all companies—and that may very well magnify the supposed “disconnect” between broad market returns and economic growth moving forward. During mature bull markets, economic growth usually slows, and firms in economically sensitive sectors often see the weakest earnings growth as their costs tend to be less flexible. Firms in less cyclical sectors—primarily mega-cap firms with globally diverse revenue streams and greater economies of scale—tend to have more consistent profits when economic growth tapers a bit. Investors typically become willing to pay a premium for these firms’ stable earnings growth, and P/E multiples expand. That investors are only just starting to catch up with earnings—never mind paying a premium—suggests there’s ample upside ahead for mega-cap stocks and plenty of room for this bull to run.
If you would like to contact the editors responsible for this article, please message MarketMinder directly.
*The content contained in this article represents only the opinions and viewpoints of the Fisher Investments editorial staff.
Get a weekly roundup of our market insights
Sign up for our weekly e-mail newsletter.

You Imagine Your Future. We Help You Get There.
Are you ready to start your journey to a better financial future?

Where Might the Market Go Next?
Confidently tackle the market’s ups and downs with independent research and analysis that tells you where we think stocks are headed—and why.
Related Resources
-
Economics Quick Hit: Durably Broad-Based Growth2026-07-29
-
Market Analysis On the Chop in the Oil Market2026-07-29
-
Politics Takaichi Raises Japan’s Wall of Worry2026-07-27
-
In The News Why Kevin Warsh should think twice about hiking interest rates — even as anxiety over the Iran war grows2026-07-27


Learn More
Learn why 210,000 clients trust us to manage their money and how Fisher Investments and its affiliates may be able to help you achieve your financial goals.
As of 6/30/2026
New to Fisher? Call Us.
Contact Us Today