Personal Wealth Management / Behavioral Finance
Amid Volatility, Beware Your Inner Investing Demons
With volatility up, investors should be conscious of how their brains may blindside them.

Ebola, deflation, the Fed (!), bond market liquidity, technical indicators and more. The media seems obsessed with hunting down larger explanation for recent volatility. The more obsessive they get, the more likely investors get caught up in all the noise, increasing the risk their brains get the best of them. Take note: Now is a time to be conscious of your inner investing demons-the kind that can cause you to act counter to your long-term goals. Recognizing these pitfalls is a key step to keeping them in check.
Year to date, the MSCI World Total Return Index has closed more than 1% up or down 18 days.[i] Of those 18, five came in October's 13 trading sessions, and two had intraday swings of greater than 1% (one was greater than 2%) this tally doesn't capture.[ii] Friday continued October's choppy start, with the MSCI World jumping +1.3% (yes, big up is still volatility). At one point, the global gauge had fallen -9.3% from its peak.[iii] After Friday's big bounce, global stocks were -8.1% below the peak.[iv] Will they fall further? No one can know, in our view. There is no way to tell if Friday's bounce marked the end of the short-term dip. We'll know if markets avoided the first technical correction since 2012 only in hindsight.[v] But we do know when volatility runs higher, it often triggers humans' innate fight-or-flight instinct. This is a useful evolutionary reaction when you are trying to avoid being a wild animal's lunch, but it isn't helpful in markets, which require rationality. Maybe you're above making such errors. That's possible. But at the same time, it doesn't hurt to review some typical mental errors so you can learn from others' mistakes and hopefully avoid making them.
Recency bias is one pitfall many investors succumb to when markets get rocky. Recency bias is the tendency to take very recent market behavior and extrapolate it forward, sometimes to degrees most people would think irrational when coolheaded. It's easy to see how you might get engulfed by this today, as headlines proclaim, "October's Wild Ride Isn't Over Yet" and attempt to explain "Why All This Market Volatility Is Here to Stay."
This same thing happened during the last global market correction (03/19/2012-06/04/2012)-when the MSCI World Total Return Index dropped -12.5%. At the time, headlines shouted markets would keep sliding. The "trend" (which some suggest is your friend) was lower. That combination perhaps made you think the market was headed south. But as Exhibit 1 shows, the trend isn't always your friend, and those dour headlines certainly weren't in 2012. Recent market action doesn't predict the future-nothing in markets' current behavior means they'll continue that trend. Volatility doesn't beget volatility or calm. Negativity doesn't breed positivity or negativity. A correction doesn't tell you anything about whether a bear is near or far. Past performance just isn't indicative of future returns.
Exhibit 1: Hypothetical Extrapolation of MSCI World Total Return Index, 03/19/2012-12/31-2012
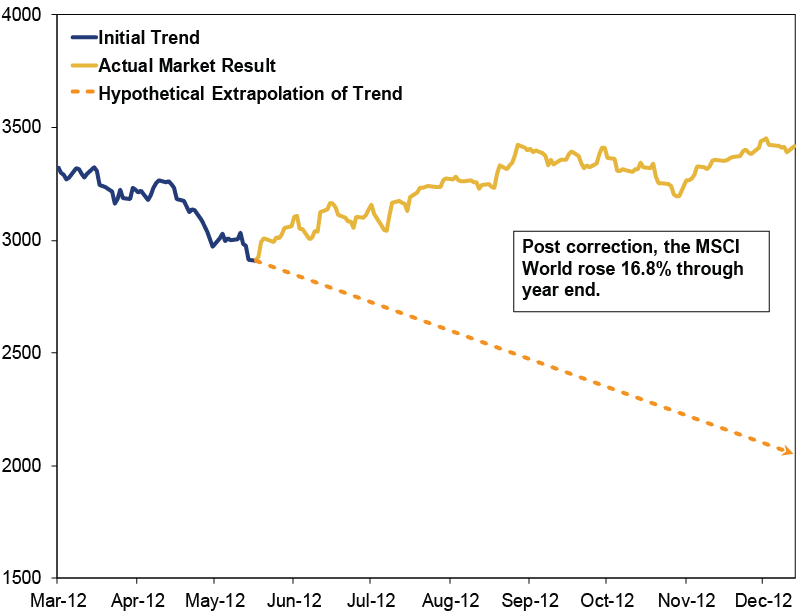
Source: FactSet, as of 10/20/2014. MSCI World Total Return Index. Hypothetical line (orange dashes) is the average daily return between correction start and correction end (03/19/2012 - 06/04/2012) extrapolated over the period 06/05/2012 - 12/31/2012, for illustrative purposes only.
Another threat during volatile periods is confirmation bias-a selective view of evidence that finds supporting factoids but rejects those that contradict the thesis. For instance, investors might think stocks will continue falling due to global growth concerns. Since many media outlets support their theory, they could feel assured they're right. One media outlet recently found 58% of Americans believe the world is "going to [heck] in a handbasket." (Their words exactly, other than "heck.") But they ignore other data suggesting the global economy is chugging along-like the Conference Board's Leading Economic Indexes, which are high and rising for many countries. They focus on the Empire State regional manufacturing gauge's sharp slump but omit the Philly Fed's, which beat expectations and showed continued growth. They don't balance Germany's weak August economic readings with hot July numbers. These tendencies work against investors by showing only a partial picture-a skewed, alternate view that may run counter to reality.
These flare during periods of negative volatility because of another behavioral tendency: myopic loss aversion. In 1979, psychologists Amos Tversky and Nobel Laureate Daniel Kahneman conducted a series of experiments using hypothetical questions to test the theory that humans tend to weigh evidence and make coolly rational decisions. Their findings? Investors hate losses about two and a half times more than they appreciate equivalent gains. That pain triggers the current search for cause-if there is a larger cause, your brain wants you to avoid the pain to come! But it can blind you in the process. And make something causeless look far more ominous than it may actually be.
Stock Market Outlook
Like what you read? Interested in market analysis for your portfolio? Why not download our in-depth analysis of current investing conditions and our forecast for the period ahead. Our latest report looks at key stock market drivers including market, political, and economic factors.
[i] FactSet, as of 10/20/2014. MSCI World Index including net dividends. 12/31/2013-10/17/2014.
[ii] FactSet, as of 10/20/2014. MSCI World Index including net dividends. 10/01/2014-10/17/2014.
[iii] FactSet, as of 10/20/2014. MSCI World Index including net dividends. 07/03/2014-10/16/2014.
[iv] FactSet, as of 10/20/2014. MSCI World Index including net dividends. 07/03/2014-10/17/2014.
[v] MSCI World Total Return Index (03/19/2012-06/04/2012).
If you would like to contact the editors responsible for this article, please message MarketMinder directly.
*The content contained in this article represents only the opinions and viewpoints of the Fisher Investments editorial staff.
Get a weekly roundup of our market insights
Sign up for our weekly e-mail newsletter.

You Imagine Your Future. We Help You Get There.
Are you ready to start your journey to a better financial future?

Where Might the Market Go Next?
Confidently tackle the market’s ups and downs with independent research and analysis that tells you where we think stocks are headed—and why.
Related Resources
-
Expert Commentary This Week in Review | Global PMIs, SpaceX, RMD Planning
 2026-07-10
 -
Market Analysis Trim Your Angst on Economic Measurement Tweaks2026-07-09
-
Politics Long-Term Forecasts and Court Verdicts: The Latest in British and French Politics2026-07-09
-
Corporate Information How You Benefit from Fisher Investments' Transparent Fee Structure
 2026-07-08


Learn More
Learn why 210,000 clients trust us to manage their money and how Fisher Investments and its affiliates may be able to help you achieve your financial goals.
As of 6/30/2026
New to Fisher? Call Us.
Contact Us Today