Personal Wealth Management / Market Analysis
Bonds’ ‘Bear Market’ Doesn’t Negate Their Purpose
Judge their shock-absorbing portfolio role over your entire investment time horizon, not just one rocky stretch.

By some measures, bonds have entered a bear market (typically a prolonged fundamentally driven decline exceeding -20%) this year along with stocks. In blended portfolios, bonds are usually supposed to provide asset-class diversification, cushioning against equity volatility for those whose goals, needs and comfort with volatility make that desirable. But given this year’s environment, you may ask: If bonds don’t mitigate portfolio swings, why own them at all? In our view, although bonds may disappoint temporarily, they still provide adequate cushion over investors’ required time horizons.
First, let us explore the so-called “bond bear market” headlines have touted recently. One widely watched bond benchmark, the Bloomberg Global Aggregate Bond Index, has fallen -21.2% from its January 4, 2021 peak on a total return basis.[i] But it includes non-US dollar-denominated investment-grade debt from 24 markets abroad. Given the US dollar’s strength over the last year, a big chunk of the Global Aggregate’s decline stems from currency translation.
In our view, most long-term investors whose portfolios include fixed income are probably better served investing in their own nations’ bonds. Unlike stocks, in our view, a bond allocation’s purpose is to dampen expected volatility versus an all-equity portfolio. Adding currency risk cuts against that objective. So for US investors, we think it is better to look at domestic bond indexes. The same goes for UK, Australian and Canadian investors, to name a few.
With that noted, the ICE BofA US 7 – 10-Year Government & Corporate Bond Index—from its August 6, 2020 peak—is down -16.7%.[ii] In comparison, the ICE BofA Sterling Broad Market Bond Index for the UK fell -24.6% in pounds from its December 11, 2020 peak.[iii] Meanwhile, Canada’s and Australia’s ICE BofA Broad Market Bond Indexes are down -14.4% and -13.5% in Canadian and Australian dollars, respectively, from their peaks on August 4, 2020 and November 6, 2020.[iv]
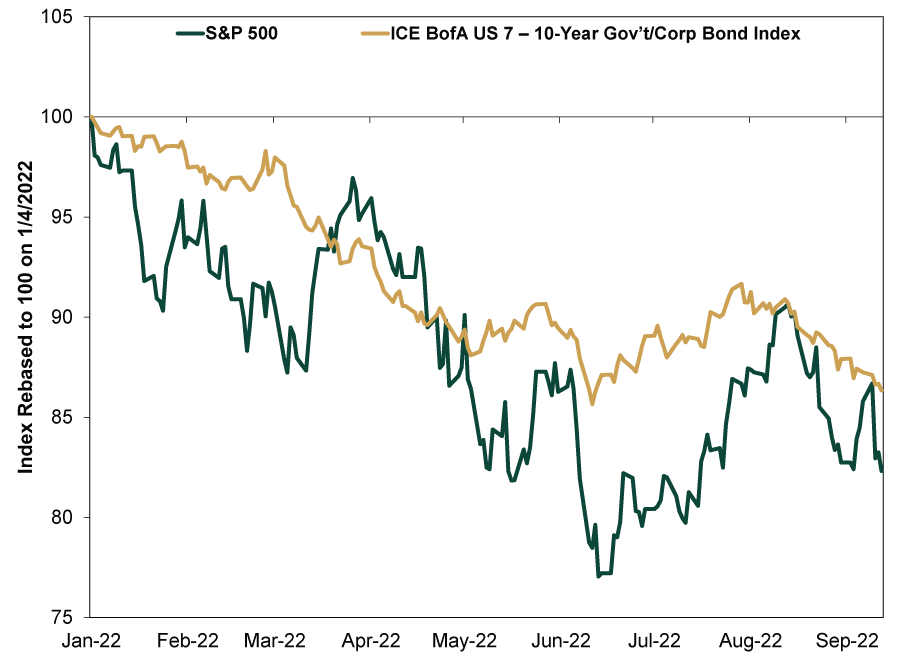
Double-digit bond declines aren’t ideal, but by the same token, bonds were never riskless to begin with—like stocks, they are subject to occasional volatility. What matters for investors with blended allocations, though: Bonds are less volatile—overall and on average—than stocks. Although it hasn’t felt great, that has still been the case this year: Since stocks’ bear market started January 4, 2022, the ICE BofA US 7 – 10-Year Government & Corporate Bond Index has fallen -13.7% versus the S&P 500’s -17.7%, cushioning—not eliminating—the blow.[v] (Exhibit 1) Its smoother path has also helped investors taking cash flows from their portfolios, as it has made the precise timing of security sales and distributions less impactful to overall returns than it would be for someone with an all-stock portfolio.
Exhibit 1: What Bonds’ Dampening Overall Portfolio Volatility Looks Like
Source: FactSet, as of 9/15/2022. S&P 500 and ICE BofA US 7 – 10-Year Government & Corporate Bond Index total returns, 1/4/2022 – 9/15/2022.
This latest episode is a reminder: Stocks and bonds often don’t move in opposite directions. A look back at recent history shows it happens even in bear markets, like the last two. In September 2008, for example, as Lehman Brothers was on the verge of collapse, stocks dropped precipitously, and bonds a bit less so, as Exhibit 2 shows. But by December, bonds had recovered, while stocks would take a few more years to regain their prior high.
Exhibit 2: During Bear Markets, Stocks and Bonds Can Move Together
Source: FactSet, as of 9/15/2022. S&P 500 and ICE BofA US 7 – 10-Year Government & Corporate Bond Index total returns, 9/9/2008 – 12/31/2009.
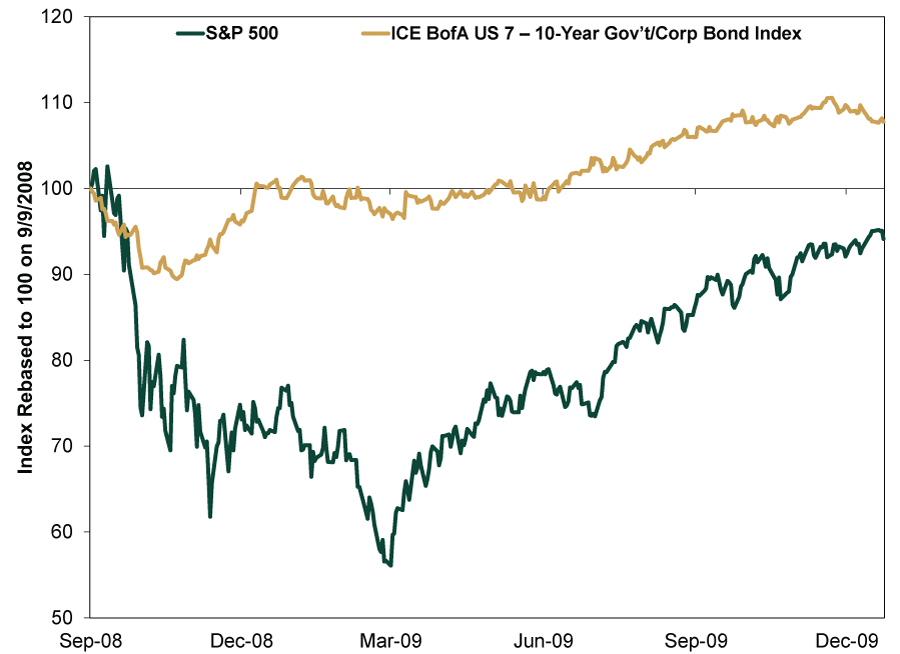
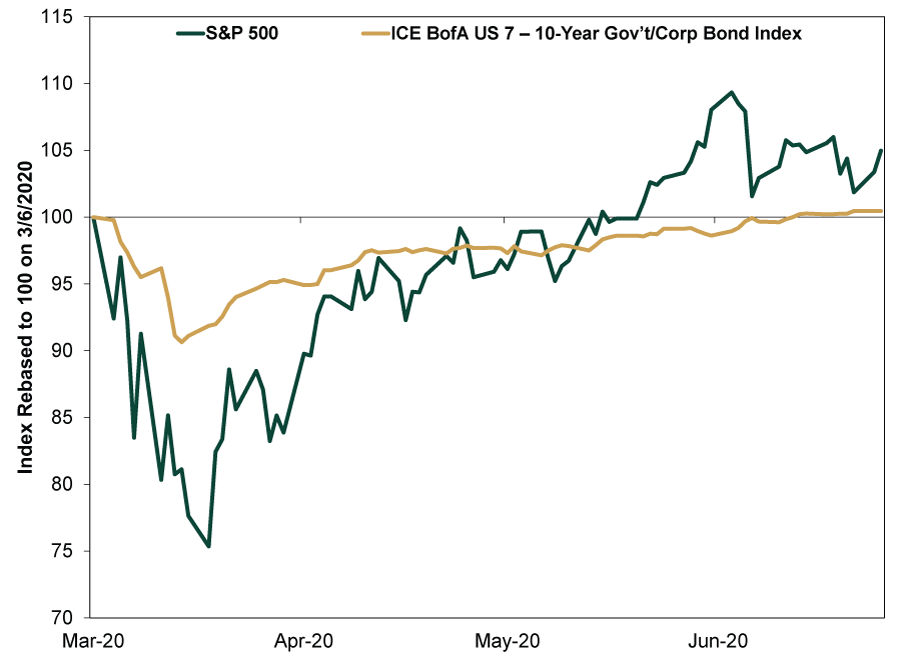
Exhibit 3 shows a similar situation occurred during March 2020’s initial pandemic lockdown. Bonds fully recovered in about three months and stocks a few months after that (note: the S&P 500 peaked earlier than the chart begins, on 2/20/2022). In both cases, bonds’ fall during an equity bear market was initially unsettling to many, yet it nevertheless provided a cushion. Then, as time wore on, volatility between them evened out as stocks eventually snapped back. The lesson: Don’t extrapolate volatility forward—the bonds in your portfolio are there to help tide you through rough spots, even if it doesn’t always seem like it in the heat of the moment.
Exhibit 3: But That Doesn’t Mean Bonds Can’t Function to Limit Downside
Source: FactSet, as of 9/15/2022. S&P 500 and ICE BofA US 7 – 10-Year Government & Corporate Bond Index total returns, 3/6/2020 – 6/30/2020.
Moreover, bonds’ downturn to us looks akin to stocks’ largely sentiment-driven bear market this cycle. They seem to be moving on similar fears, especially in bonds’ case: inflation, Fed rate hikes and the forthcoming acceleration of the Fed’s balance sheet runoff. The 10-year Treasury yield hit as high as 3.5% June 14, fell to 2.6% August 1 and is now back up to 3.5%.[vi] Such big volatility amid pronounced Fed chatter suggests it is roiling short-term sentiment.
But supposed Fed “tightening” is wildly exaggerated. Take the latest hubbub over so-called quantitative tightening, set to let $95 billion of bonds on the Fed’s balance sheet mature every month without replacement, reversing its quantitative easing asset purchases. People worry the deluge of bond supply hitting markets will overwhelm them and send bond yields skyward, as if the Fed is the only source of demand for Treasurys. Yet every month this year, daily trading volumes for Treasury securities averaged well over $500 billion.[vii] In August, just for Treasurys with maturities greater than six years, trading volumes averaged $175.6 billion a day. The Fed’s planned runoff in comparison is a drop in the bucket.
The large fuss over the Fed’s glacial—and well-known—balance sheet shrinkage overrates reality, in our view. Sentiment may continue to whipsaw bonds, but we think underlying fundamentals are far more supportive than those fearing a bond bear market rout give them credit for.
[i] Source: FactSet, as of 9/15/2022. Bloomberg Global Aggregate Bond Index total return, 1/4/2021 – 9/15/2022.
[ii] Source: FactSet, as of 9/15/2022. ICE BofA US 7 – 10-Year Government & Corporate Bond Index total return, 8/6/2020 – 9/15/2022.
[iii] Source: FactSet, as of 9/15/2022. ICE BofA Sterling Broad Market Bond Index total return in GBP, 12/11/2020 – 9/15/2022.
[iv] Source: FactSet, as of 9/15/2022. ICE BofA Canada Broad Market Bond Indexes total returns in CAD, 8/4/2020 – 9/15/2022, and ICE BofA Australia Broad Market Bond Indexes total returns in CAD, 11/6/2020 – 9/15/2022.
[v] Source: FactSet, as of 9/15/2022. S&P 500 and ICE BofA US 7 – 10-Year Government & Corporate Bond Index total returns, 1/4/2022 – 9/15/2022.
[vi] Source: Federal Reserve Bank of St. Louis, as of 9/15/2022. 10-year Treasury yield, 6/14/2022 – 9/15/2022.
[vii] Source: Securities Industry and Financial Markets Association, as of 9/15/2022.
If you would like to contact the editors responsible for this article, please message MarketMinder directly.
*The content contained in this article represents only the opinions and viewpoints of the Fisher Investments editorial staff.
Get a weekly roundup of our market insights
Sign up for our weekly e-mail newsletter.

You Imagine Your Future. We Help You Get There.
Are you ready to start your journey to a better financial future?

Where Might the Market Go Next?
Confidently tackle the market’s ups and downs with independent research and analysis that tells you where we think stocks are headed—and why.
Related Resources
-
Market Analysis The New Tariffs in Town Are Still Old News2026-07-24
-
Expert Commentary This Week in Review | Market Volatility, Tariffs, SpaceX
 2026-07-24
 -
Economics A Summertime Check-in on US Consumers2026-07-23
-
Expert Commentary Why Ken Fisher Is Optimistic About European Stocks
 2026-07-23


Learn More
Learn why 210,000 clients trust us to manage their money and how Fisher Investments and its affiliates may be able to help you achieve your financial goals.
As of 6/30/2026
New to Fisher? Call Us.
Contact Us Today