Personal Wealth Management / Financial Planning
How to Think About Bonds’ Rocky Q1
It doesn’t mean their portfolio role is obsolete.

In Q1, the S&P US Aggregate Bond Index fell -5.6%—exceeding the S&P 500’s -4.6% decline.[i] Seeing this, some investors with blended fixed-income and equity asset allocations may question the logic of owning bonds. If they fall more than stocks in a volatile market, what is the point? But in our view, this conflates volatility and negativity, which aren’t synonymous. We don’t think occasional wobbles should make you ditch your bond allocation, which can still dampen portfolio swings.
Bonds may dip (or spike), but they typically do so to a smaller degree than stocks. Take the current situation. Without context, bonds’ adding to stocks’ Q1 negativity may look less than beneficial. But consider a more granular view. While bonds didn’t move opposite stocks in Q1, that isn’t unusual—the two aren’t really negatively correlated in any meaningful way. The degree of movement is telling, though. During the quarter, stocks fell as much as -12.3% on March 8.[ii] On that day, bonds were down only -3.9% quarter to date.[iii] At their worst in Q1, March 25, bonds were off -6.5%—half stocks’ worst.[iv] That means the margin of swings is smaller—potentially beneficial if you are drawing cash flow.
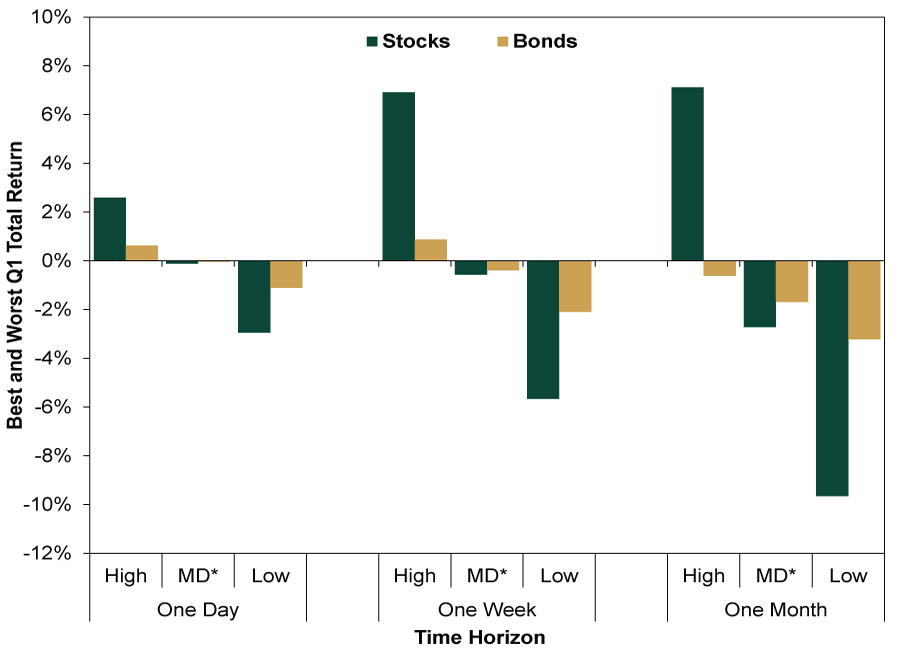
Look at this another way. Exhibit 1 shows stocks’ and bonds’ best, worst and median one-day, one-week and one-month returns last quarter. For example, stocks’ (in green) best one-day return last quarter was 2.6% and their worst was -2.9%, with a median one-day decline of -0.1%, which you can see if you squint. Bonds’ (yellow) best one-day return was 0.6% and their worst -1.1%, with a median rounding to 0%. So investors whose goals, time horizon and cash flow needs are commensurate with a blended allocation are still seeing smaller gyrations.
Exhibit 1: Bonds Swung Less Than Stocks Last Quarter—and Dampened Portfolio Volatility
Source: FactSet, as of 4/5/2022. S&P 500 and S&P US Aggregate Bond total returns, rolling 1-, 5- and 21-day trading periods, 12/31/2021 – 3/31/2022. *Median.
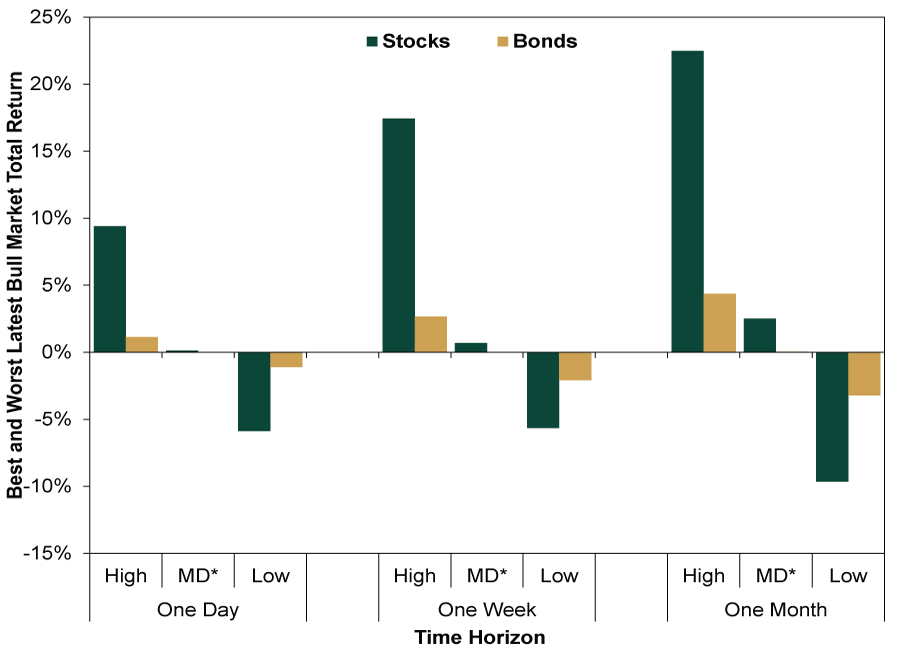
That was just for last quarter, but blended allocations over the entire current bull market so far, starting in late March 2020, exhibit the same general behavior. (Exhibit 2) Sometimes stocks and bonds fall together—for a day, week, month or even quarter. But that doesn’t mean bonds aren’t doing the job we think they are meant to in blended allocations—moving less than stocks and dampening overall portfolio volatility.
Exhibit 2: Through the Bull Market So Far, Too
Source: FactSet, as of 4/5/2022. S&P 500 and S&P US Aggregate Bond total returns, rolling 1-, 5- and 21-day trading periods, 3/23/2020 – 3/31/2022. *Median.
So while bonds can be volatile, they generally don’t swing as much in the short run as stocks do. Why? They have different drivers. Bonds move mainly on inflation and inflation expectations, as most make fixed payments over their maturities, and the value of their purchasing power fluctuates depending on investors’ perceptions of future inflation. (Perceptions of creditworthiness factor in as well depending on the individual issuer, of course, but not as much for the asset class as a whole and still less for the investment grade universe.) While perceived purchasing power erosion can evolve and shift—as we have seen over the last year—it usually doesn’t vary greatly. Also note it is one widely watched variable. Stocks move mostly on the forward-looking gap between the likely reality and current expectations already priced in for corporate profits—with a host of variables influencing that spread. But both asset classes can be subject to sentiment-driven swings, which seems to be largely what was at work in Q1.
For investors now, though, bonds’ having a negative quarter with stocks is all water under the bridge. What are they likely to do going forward? When assessing bond positioning today, consider the inflation and interest rate outlook ahead. In our view, upside pressure on rates probably peters out from here. Yes, the Fed is hiking short-term rates and has talked of reducing its $8.5 trillion bond portfolio, amassed from its quantitative easing purchases. Last month’s meeting minutes showed the Fed is planning to shrink its balance sheet at a $95 billion monthly rate starting in May, but we think this just firms up expectations of what markets were already anticipating. The last time the Fed first started floating balance sheet reductions in early 2017, 10-year Treasury yields had already risen from 1.4% in July 2016 to a high of 2.6% in March 2017—a situation not too dissimilar from the current one.[v] Long-term yields mostly drifted lower thereafter.
Bonds largely pre-price Fed decisions and then move on, in our view, focusing on forward-looking fundamentals. While recent energy and commodity driven price spikes may keep inflation elevated for longer than we thought previously, a further material up move from here doesn’t look very probable to us. Those factors are simply too widely watched and likely already reflected in 10-year Treasury yields’ rise from their August 2020 low of 0.5% to 2.6% now.[vi] Materially rising rates from current levels would probably take a new factor prolonging inflation more than investors expect presently. From a strictly market and economic perspective—being agnostic about political ramifications—we think businesses responding to price signals in the relatively near future is more likely to slow inflation than another shock is to accelerate it.
In our view, bonds’ recent volatility just argues for knowing—and managing—those risks in the overall context of your short, intermediate and long-term financial goals.
[i] Source: FactSet, as of 4/7/2022. S&P US Aggregate Bond and S&P 500 total returns, 12/31/2021 – 3/31/2022.
[ii] Ibid. S&P 500 total return, 12/31/2021 – 3/8/2022.
[iii] Ibid. S&P US Aggregate Bond total return, 12/31/2021 – 3/8/2022.
[iv] Ibid. S&P US Aggregate Bond total return, 12/31/2021 – 3/25/2022.
[v] Ibid. 10-year Treasury yield, 7/5/2016 – 3/13/2017.
If you would like to contact the editors responsible for this article, please message MarketMinder directly.
*The content contained in this article represents only the opinions and viewpoints of the Fisher Investments editorial staff.
Get a weekly roundup of our market insights
Sign up for our weekly e-mail newsletter.

You Imagine Your Future. We Help You Get There.
Are you ready to start your journey to a better financial future?

Where Might the Market Go Next?
Confidently tackle the market’s ups and downs with independent research and analysis that tells you where we think stocks are headed—and why.
Related Resources
-
Expert Commentary 3 Things You Need to Know This Week | Q2 Earnings, ECB Meeting, Trump Accounts
 2026-07-20
 -
Weekly Wrap-Up Fisher Investments Reviews: Last Week in Markets—July 13 - July 172026-07-20
-
Market Analysis Pumping Up the Yen?2026-07-17
-
Expert Commentary This Week in Review | US-Iran Conflict, US Inflation, New UK Prime Minister
 2026-07-17


Learn More
Learn why 210,000 clients trust us to manage their money and how Fisher Investments and its affiliates may be able to help you achieve your financial goals.
As of 6/30/2026
New to Fisher? Call Us.
Contact Us Today