Personal Wealth Management / Market Analysis
Dissecting the Buffett Indicator
Despite the titular tie to arguably the greatest living investor, this valuation measure lacks predictive power.

“The best single measure of where valuations stand at any given moment.”[i] That is how the Sage of Omaha, Warren Buffett, described the ratio of US stock market capitalization to nominal GNP in late 2001. Today, GDP has replaced GNP as the standard economic output measure globally.[ii] Hence, many cast market cap to nominal GDP as the “Buffett Indicator,” lumping it with P/E ratios and other valuations as a gauge of whether stocks are overvalued. Now it has smashed through early 2000’s peak—a bad omen, allegedly. But we see several problems with presuming this metric predicts a shift in the market cycle. Here is a close inspection.
The alarm’s alleged cause: US-listed stocks’ market cap, as measured by the Wilshire 5000 Index, is approaching twice America’s GDP, far above the dot-com bubble’s 1.4 high. (Exhibit 1) After initially plunging in last year’s bear market, the Buffett Indicator has surged higher. That move higher is partly the result of lower GDP, which hasn’t fully recovered its first-half 2020 tumble yet. Meanwhile, stock prices are well beyond pre-pandemic highs, pushing market cap way up. Many pundits see this as yet another factor indicating markets are frothy—detached from economic reality.[iii]
Exhibit 1: The Buffett Indicator
Source: FactSet and Federal Reserve Bank of St. Louis, as of 3/9/2021. Ratio of Wilshire 5000 Total Market Capitalization Index to nominal GDP, Q1 1985 – Q4 2020.
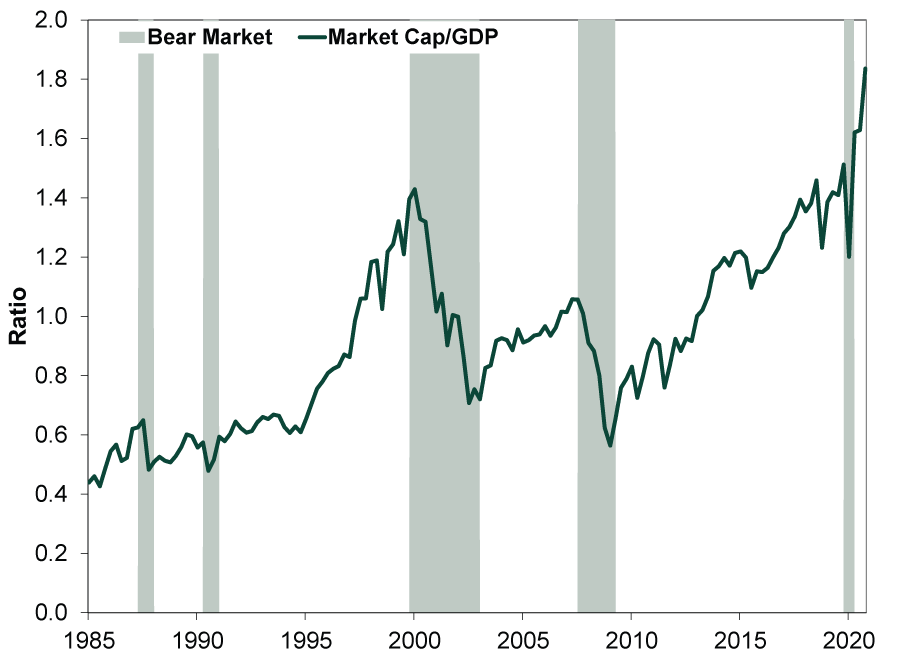
But in our view, this disconnect is entirely normal. Generally, stocks flourish late in recessions and early thereafter. Hence, the market cap to GDP ratio has spiked coming out of every recession over the last seven decades. For instance, the Buffett Indicator hit its low point early in 1990’s recession—just like 2020’s. It had rebounded significantly by the recession’s end and kept climbing irregularly through 2000’s peak. Simply, stocks (the Buffett Indicator’s numerator) move before GDP (the ratio’s denominator). Stocks anticipate the economic conditions GDP attempts to quantify later. For the same reason, big declines occur during bear markets—which usually begin before GDP falls. Big upturns and downswings around economic and market inflection points are just a function of math.
We have long questioned why anyone would think the Buffett Indicator is a timing tool, considering a) GDP comes out at a big lag and b) even its namesake doesn’t use it as such—and not just because Berkshire Hathaway is a holding company that tends to buy companies for the very long haul. Rather, as Buffett acknowledged in 2013, downplaying the gauge: “It’s not that precise.”[iv] More than a decade after he touted it, he said it was only good for a particular time—2000’s mania. With the benefit of hindsight, he also observed stocks generally range in a “zone of reasonableness” the vast majority of the time.
Conceptually, comparing market cap to GDP doesn’t confer any special insight into where stocks are headed next. Stocks care about future earnings 3 – 30 months out. Shares are a slice of ownership in that future. Their prices reflect what investors think those earnings will be worth. That depends heavily on what earnings will actually be—the determination of which is no easy feat, of course—but also investors’ general mood. Measuring feelings is more art than science, in our view, and not easily quantified. Also worth consideration: America’s biggest market cap companies generate significant earnings outside the US. Therefore, they reflect global growth, not just America’s, which is one reason stocks have risen faster than GDP over time.
GDP is a flow of economic activity, which doesn’t fully overlap with corporate America. It tallies what happened last quarter, whereas forward-looking markets anticipate the next several quarters. It includes spending and investment by households, governments and small businesses, which are only tangentially related to most publicly traded corporations, especially those with substantial operations abroad. Moreover, government investment sometimes crowds out the private sector, so even if it adds to GDP, that isn’t necessarily great for stocks. GDP’s treatment of imports also isn’t quite rational from a corporate perspective. Many publicly traded companies sell imports, so they are often a net boon to profits and revenues. They may also be a cost influence, for better or worse. But they don’t register in GDP. The metric’s calculation subtracts imports, offsetting their inclusion in consumer spending and business investment categories. This is arguably appropriate for the metric, as GDP is an effort to tabulate single-country output. But it obviously creates a disconnect from corporate reality.
Lastly, consider what would happen if the Buffett Indicator ever actually worked. Very likely, markets would price it in quickly and its effectiveness would cease. Markets are extremely efficient and adaptive. If something regularly works, like Ken Fisher’s price-to-sales ratio did in the early 1980s, many investors will start following it. As they do, its edge will erode. In markets, a tool everyone has or knows about isn’t worth much. The Buffett Indicator? It is named for the most famous living investor, yet pundits hype it as some kind of hidden knowledge. That seems like a stretch to us. If this gauge ever offered material insight, we would argue that is well behind us now, considering the branding and vast attention it gets.
In our view, no one indicator can show you whether stocks are cheap or expensive. But even if one could, it still wouldn’t tell you whether they will get cheaper or pricier in the immediate future, particularly one followed as broadly as the Buffett Indicator.
[i] “Warren Buffett on the Stock Market,” Warren Buffett and Carol Loomis, Fortune, 12/10/2001.
[ii] GNP measures economic output produced by its country’s citizens living domestically and abroad. GDP—gross domestic product—captures only production within a country’s borders whether from its citizens or not. Since most countries use GDP, not GNP, America switched to allow for better comparisons of economic activity. In practice, though, there is little actual difference between US GNP and GDP.
[iii] Although notably, not Buffett.
[iv] “Warren Buffett Talks All-Time Record Highs on Wall Street, Stock Prices in the Future,” Amanda Cochran, CBS, 11/19/2013.
If you would like to contact the editors responsible for this article, please message MarketMinder directly.
*The content contained in this article represents only the opinions and viewpoints of the Fisher Investments editorial staff.
Get a weekly roundup of our market insights
Sign up for our weekly e-mail newsletter.

You Imagine Your Future. We Help You Get There.
Are you ready to start your journey to a better financial future?

Where Might the Market Go Next?
Confidently tackle the market’s ups and downs with independent research and analysis that tells you where we think stocks are headed—and why.
Related Resources
-
Market Analysis On the June Inflation Cooldown2026-07-14
-
Expert Commentary 3 Things You Need to Know This Week | US Inflation, China GDP, US Retail Sales
 2026-07-13
 -
Weekly Wrap-Up Fisher Investments Reviews: Last Week in Markets—July 6 - July 102026-07-13
-
Expert Commentary This Week in Review | Global PMIs, SpaceX, RMD Planning
 2026-07-10


Learn More
Learn why 210,000 clients trust us to manage their money and how Fisher Investments and its affiliates may be able to help you achieve your financial goals.
As of 6/30/2026
New to Fisher? Call Us.
Contact Us Today