Personal Wealth Management / Market Analysis
Don’t Fret Debt
Using apples-to-apples comparisons to underlying assets, the U.S. could afford even more debt.

With the Trump administration taking office in less than two weeks, folks may wonder about the US debt situation, particularly since President-elect Trump talked up fiscal stimulus on the campaign trail and will almost assuredly face a budget and/or debt ceiling debate this year. But beyond the political rhetoric, investors should take note: There is no sign US debt is at all problematic.
Don't take our word for it. The largest and most liquid financial markets are unconcerned about US debt. Otherwise lenders to the US would be unwilling to fund the Treasury at historically low rates. If a prospective borrower wasn't very creditworthy, a lender would demand higher rates to compensate for the risk of not getting their money back. This is clearly not happening.
Currently, to borrow money for 10 years, the US Treasury must pay lenders about 2.4% a year.[i] While this is a full percentage point higher than the record-low 1.4% notched last July, it's still lower than almost any point since 1962 (see Exhibit 1). Rates could rise another full percentage point and still be low by historical standards.
Exhibit 1: US Borrowing Rates Still Pretty Darn Low
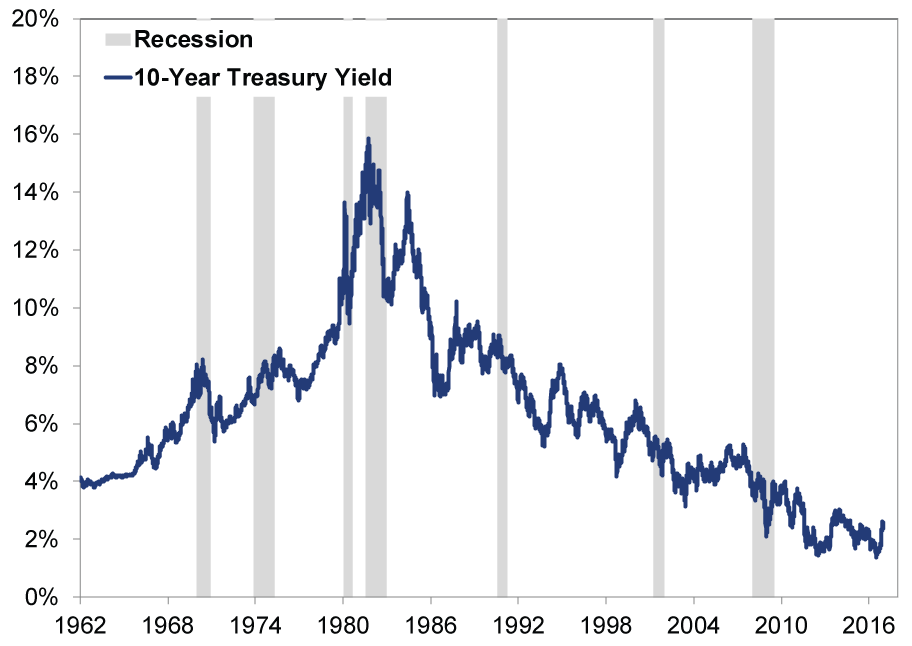
Source: St. Louis Federal Reserve, as of 1/10/2017.
How to Gauge Credit Risk
Why can the US borrow so cheaply? Because what bondholders and other lenders care about is getting paid. Part of their confidence in US debt comes from its backing by the full faith and credit of Uncle Sam, who has a shiny record of paying back debt, with interest. But also, despite the seemingly eye-popping numbers, US debt isn't all that large. Yes, gross public debt rose $1.4 trillion to $19.6 trillion in Q3 2016 from a year ago. But gross debt isn't the best measure, because it includes bonds the government owns, whether through Social Security or other vehicles-basically money the government owes itself, which effectively cancels. More meaningful is net public debt, or all the debt held by investors here and abroad. This figure, $14.2 trillion, is 76% of GDP, in line with other creditworthy countries.
Then again, debt-to-GDP doesn't tell the whole story, and it isn't the best comparison. Mathematically, it tells you how many years it would take to pay off debt (regardless of interest rates) if all GDP were used to that end. This just isn't a realistic assumption. No one expects the US to pay off its debts. Nor would that be desirable. US Treasurys are vital to global financial markets as collateral, investments and a reference rate for other debt. They underpin much of our money stock. As Alexander Hamilton put it in 1781: "A national debt, if it is not excessive, will be to us a national blessing. It will be a powerful cement of our Union."[ii]
Moreover, debt is a balance sheet "stock" measure, whereas GDP is a "flow" measure on the income statement. A better, like-for-like comparison would measure debt service-interest payments to income-like lenders do. When deciding whether to underwrite a home mortgage, banks compare the borrower's extant interest payments and other financial obligations to monthly income. Using the equivalent measure-the government's interest payments to Federal receipts-Uncle Sam's debt service ratio is just 7.4%, near 50-year lows (Exhibit 2). If debt was affordable in the 1980s and 1990s, it is now, too.
Exhibit 2: Federal Debt Service Near 50-Year Lows
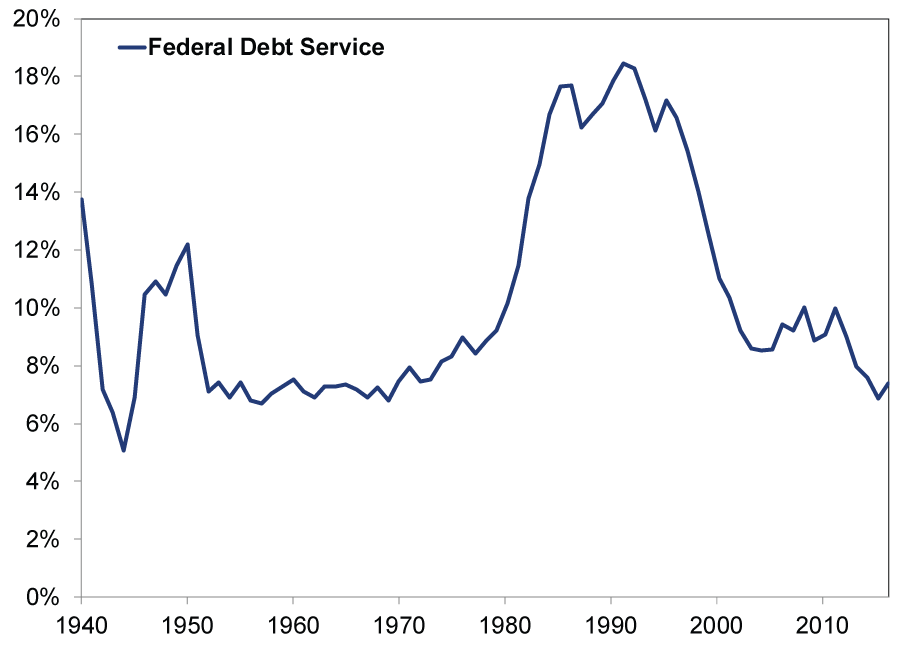
Source: St. Louis Federal Reserve, as of 1/10/2017. Annual interest outlays on Federal debt divided by Federal receipts.
You can also scale debt by comparing debt levels to total assets (which back the debt). Banks do this, too, weighing potential borrowers' assets relative to liabilities. If assets well exceed liabilities, credit risk is lower. The same goes for the US government. Since all assets and liabilities in the US are essentially owned by US households, a close proxy for "national wealth"[iii] is US household net worth (see Exhibit 3).[iv] Note that households' total assets (orange line) minus their liabilities (yellow line) is household net worth (blue line). Third quarter US household net worth is a record high $90.2 trillion ($105.1 trillion in assets minus liabilities of $14.9 trillion).
Exhibit 3: US Assets Dwarf Its Liabilities
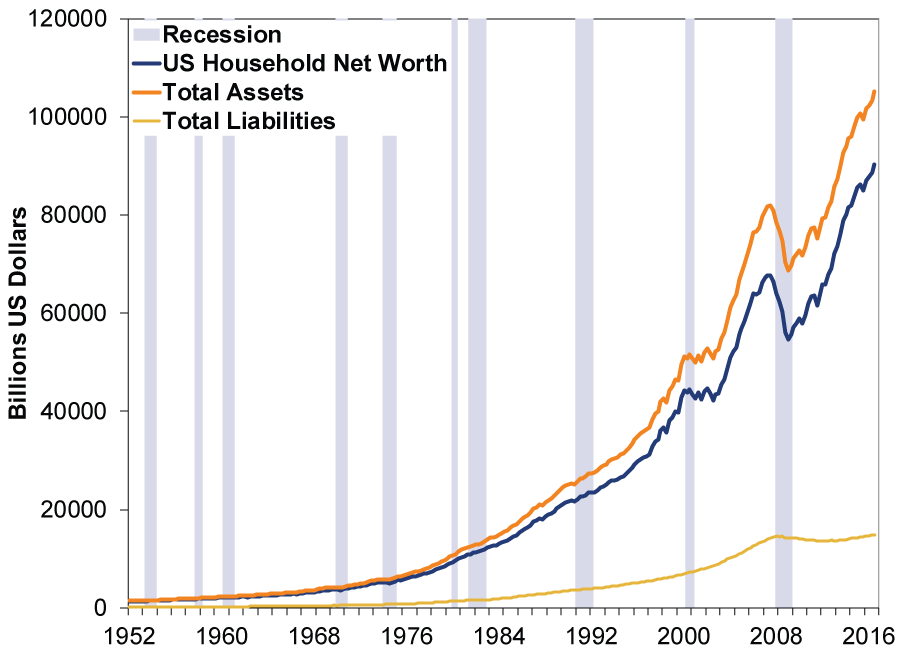
Source: St. Louis Federal Reserve, as of 1/10/2017.
What's more, the US' return on those assets is around 10%.[v] As Ken Fisher wrote in The Only Three Questions That Still Count: "Quite obviously, our return on assets is much higher than our after-tax borrowing cost of about 2% to 3%. So the way a good CFO would consider it, we're not over-indebted, we're under-indebted." Borrowing costs are even lower now than when Ken wrote that half a decade ago.
Sovereign Debt Is Different
The government budget constraint is different in a few important ways than it is for corporations or households. First, the government has taxation authority-the IRS/Treasury. Second, government controls the printing press. This might raise nightmare visions of debt monetization and hyperinflation, but that's a symptom of a failed state-think Venezuela. America isn't Venezuela. Anything is possible (good or bad) in the very long term, but markets look 30-ish months ahead at most.
Then, too, investors just like owning US Treasurys. Demand for high-quality sovereign debt is off the charts. The quality is governed not so much by the aggregate amount outstanding, but by America's sterling record of servicing debt (and not monetizing it), strong government institutions and independent central bank and judiciary.
In theory, a 75%+ debt-to-GDP ratio could be unwieldy, if investors had zero confidence in debt service and purchasing power. But getting there means lenders choosing to provide credit every step of the way. It's actually difficult for non-creditworthy countries to attain a lofty debt-to-GDP ratio, because no one wants to lend to them. Rather, it's usually achieved by economic collapse. That US debt inches up while debt service costs fall is a powerful testament to Uncle Sam's creditworthiness.
[i] FactSet, as of 1/10/2017.
[ii] Feel free to rap that quote if you want.
[iii] The Fed since 2015 has tried to provide a more accurate determination of "US net wealth," but conceptual/classification issues remain a challenge. Former Microsoft CEO Steve Ballmer, for one, is working on it.
[iv] Don't worry, this technically includes corporations, since individuals own corporations.
If you would like to contact the editors responsible for this article, please message MarketMinder directly.
*The content contained in this article represents only the opinions and viewpoints of the Fisher Investments editorial staff.
Get a weekly roundup of our market insights
Sign up for our weekly e-mail newsletter.

You Imagine Your Future. We Help You Get There.
Are you ready to start your journey to a better financial future?

Where Might the Market Go Next?
Confidently tackle the market’s ups and downs with independent research and analysis that tells you where we think stocks are headed—and why.
Related Resources
-
Market Analysis On the June Inflation Cooldown2026-07-14
-
Expert Commentary 3 Things You Need to Know This Week | US Inflation, China GDP, US Retail Sales
 2026-07-13
 -
Weekly Wrap-Up Fisher Investments Reviews: Last Week in Markets—July 6 - July 102026-07-13
-
Expert Commentary This Week in Review | Global PMIs, SpaceX, RMD Planning
 2026-07-10


Learn More
Learn why 210,000 clients trust us to manage their money and how Fisher Investments and its affiliates may be able to help you achieve your financial goals.
As of 6/30/2026
New to Fisher? Call Us.
Contact Us Today