Personal Wealth Management /
Happy Fifth Birthday, Bull Market
What does the bull’s five-year anniversary mean for its future?

As the bull market turned five on Sunday, some investors celebrated a whopping gain of about 177% since it began on March 9, 2009.[i] Yet joy is not a universal sentiment. Many, if not most, investors don’t seem to see the occasion as a time for partying. Five years happens to be a bit longer than the average bull market duration, and this bull’s magnitude is a bit above-average, too, prompting jitters the end looms. In our view, however, these fears are misplaced. Bull markets die for many reasons, but age and gravity alone aren’t among them.
That this bull is older than the average of 57 months doesn’t mean its end is nigh. The average is just that—the average of a quite variable series of numbers. Only one bull in history—1932-1937’s—has matched the average length. The bull markets beginning in 1949, 1974 and 1990 lasted well beyond five years. (Exhibit 1) The bull starting in 1966 barely got past year two. Same goes for magnitude—there, too, the average means diddly squat. Four bulls (not including this one) surpassed the average of 165%. The 1990s bull, which returned 417%, more than doubled it. By contrast, five bull markets ended well short of 100%.
A bull’s magnitude and duration alone tell you nothing—they aren’t timing tools. They’re just arbitrary signposts based on past performance. And they’re always changing! The first three bulls averaged 63.7 months and 249%. But the very next one lasted only 50 months and 86%. Heading into the 1990s bull, the average bull market magnitude was down to 145.7% and the average duration 50.6 months. Now they’re higher again. Today’s average bull market duration and magnitude aren’t any more predictive than the averages were in 1957, 1990 or at any point in the 20th century. Assuming they mean something assumes past performance dictates future returns—a falsehood.
Exhibit 1: Last 13 S&P 500 Bull Markets: Duration and Magnitude
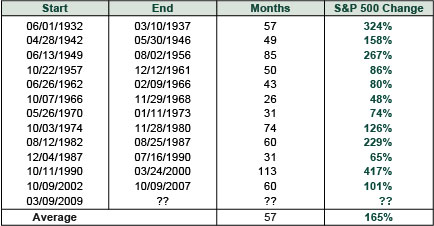
Source: FactSet, as of 12/2/2013.
Markets are forward looking—the reason these arbitrary markers of past returns aren’t predictive. Over time, stocks move most on the gap between investors’ expectations and reality. Turning points tend to come when the gap is at its widest. This bull, for example, began in March 2009 with investors expecting a Great Depression II or worse. Reality was bad, but not nearly to that magnitude. Stocks surged. This bull likely continues until expectations exceed reality in a positive sense—until euphoric investors are too past-performance drunk to notice deteriorating fundamentals. That isn’t always the case, but it’s the norm. Rarely, bull markets have been truncated early by an exceptional, negative event like the Nazi invasion of the Sudetenland in 1938—which cut off a nascent bull market’s bounce off the 3/31/1938 low—or the onset of FAS 157 (the fair-value or mark-to-market accounting rule) in October 2007. But those are exceptions.
The economic and political backdrop, and the degree to which investor sentiment appreciates these conditions, is what matters for stocks looking forward and today’s conditions appear far removed from a typical bull market peak. For one, sentiment is far from euphoric. There are shoots of optimism, but there is also a strong skeptical pull—expectations for future growth and earnings aren’t off the charts, and reality is stronger than most appreciate. Many fret economic weakness and the end of the Fed’s quantitative easing (QE) program, but the US Leading Economic Index (LEI) is high and rising—no recession in 50 years had started during a rising LEI trend. One of the biggest contributors to LEI’s rise is the yield spread, which has widened because QE is winding down. Plus, corporate earnings and revenues are growing, manufacturing and services new orders are rising, and consumer incomes and spending are increasing. None of this is consistent with a weakening economy. The political climate, too, is favorable, with ample gridlock in competitive, developed nations like the US, UK and Germany and free-market reforms progressing in Emerging Markets like Mexico.
Something unexpected and deeply negative could always arise to knock the bull off course, but for now, we don’t see anything that’s big, likely or underappreciated enough to cause a sudden bear market. Most of today’s risks are either too widely discussed, too small or too improbable to have a meaningful, prolonged impact. None of that is to say there won’t be volatility. There will. Volatility is a near constant in markets and a bull of any age should be expected to give a few headfakes like brief dips and corrections—short, sharp, sentiment driven moves of 10%-20% that come and go rapidly. But a long-term investor is better off taking the longer view. After all, this bull market has not been a straight shot up. Since 2009, there have been five corrections in five years. A rocky trip for those focusing on the twists and turns along the way, but a rewarding one for those who weren’t swayed.
[i] FactSet, as of 3/6/2014. S&P500 Price Index Return 3/9/2009-3/6/2014.
If you would like to contact the editors responsible for this article, please message MarketMinder directly.
*The content contained in this article represents only the opinions and viewpoints of the Fisher Investments editorial staff.
Get a weekly roundup of our market insights
Sign up for our weekly e-mail newsletter.

You Imagine Your Future. We Help You Get There.
Are you ready to start your journey to a better financial future?

Where Might the Market Go Next?
Confidently tackle the market’s ups and downs with independent research and analysis that tells you where we think stocks are headed—and why.
Related Resources
-
Market Analysis On the June Inflation Cooldown2026-07-14
-
Expert Commentary 3 Things You Need to Know This Week | US Inflation, China GDP, US Retail Sales
 2026-07-13
 -
Weekly Wrap-Up Fisher Investments Reviews: Last Week in Markets—July 6 - July 102026-07-13
-
Expert Commentary This Week in Review | Global PMIs, SpaceX, RMD Planning
 2026-07-10


Learn More
Learn why 210,000 clients trust us to manage their money and how Fisher Investments and its affiliates may be able to help you achieve your financial goals.
As of 6/30/2026
New to Fisher? Call Us.
Contact Us Today