Personal Wealth Management / Market Analysis
Inflation, Globally Speaking
A look at worldwide lending and money supply data suggests global inflation isn’t set to surge.

With US inflation ticking up recently—the Fed’s preferred gauge hit 2.0% in March—headlines warn the era of low inflation is ending and offer reasons prices may keep rising, potentially endangering the expansion. Explanations for higher prices range from oil prices to wages to inflation expectations to tax cuts to tariffs. In my view, however, all these theories ignore inflation’s root cause—how much money is chasing how many goods. From this perspective, global lending and money supply data suggest inflationary pressures remain benign.
As Milton Friedman taught, inflation is always and everywhere a monetary phenomenon. Thus, focusing on money supply and demand is paramount. It is very difficult to get inflation without an increase in global money supply. But global money supply isn’t so easy to measure—there is no omnibus data series. Nor is there a global series for lending and inflation. However, we can get pretty close using national data. The following charts combine data from the world’s 31 largest economies, with eurozone countries grouped together as one. To avoid country-specific currency skew, each series uses the year-over-year growth rate on a local currency basis. Pooled growth rates are then weighted by GDP, creating a global composite for each.
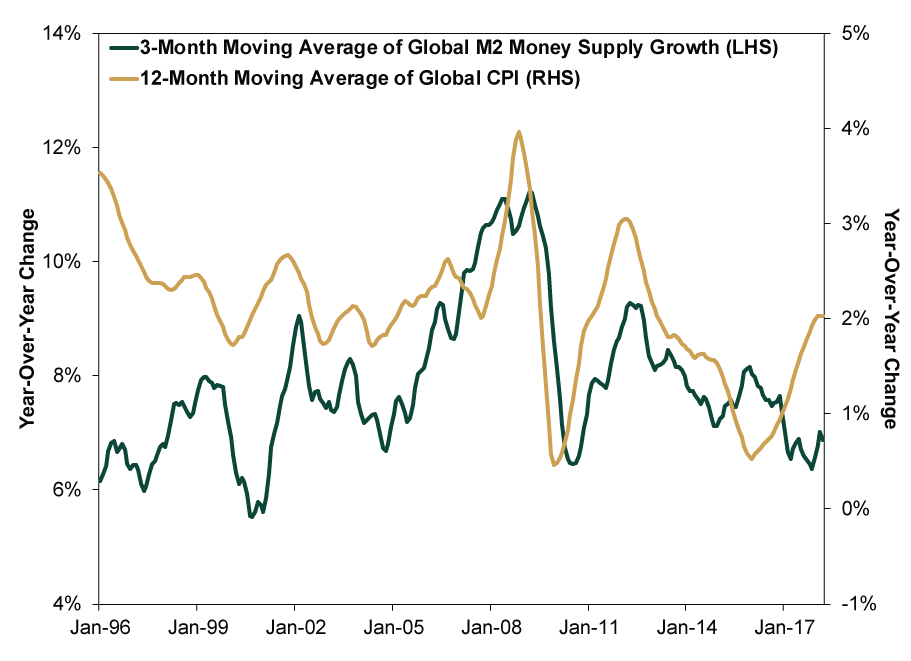
As Exhibit 1 shows, global money supply (as measured by M2)[i] tracks global aggregate inflation quite nicely overall, despite some periods where the connection falters. Regular MarketMinder readers might wonder why this uses M2 money supply instead of M4, the broadest measure—and the one we typically highlight. Unfortunately, the US and UK are the only two countries to publish M4. M2 is the most consistent and broadly available across all countries.
Exhibit 1: Global Money Supply Tracks Global Inflation Closely
Source: FactSet, as of 4/26/2018. Year-over-year percentage change in the 3-month moving average of global GDP-weighted M2 money supply and the 12-month moving average of global CPI, January 1996 – March 2018.
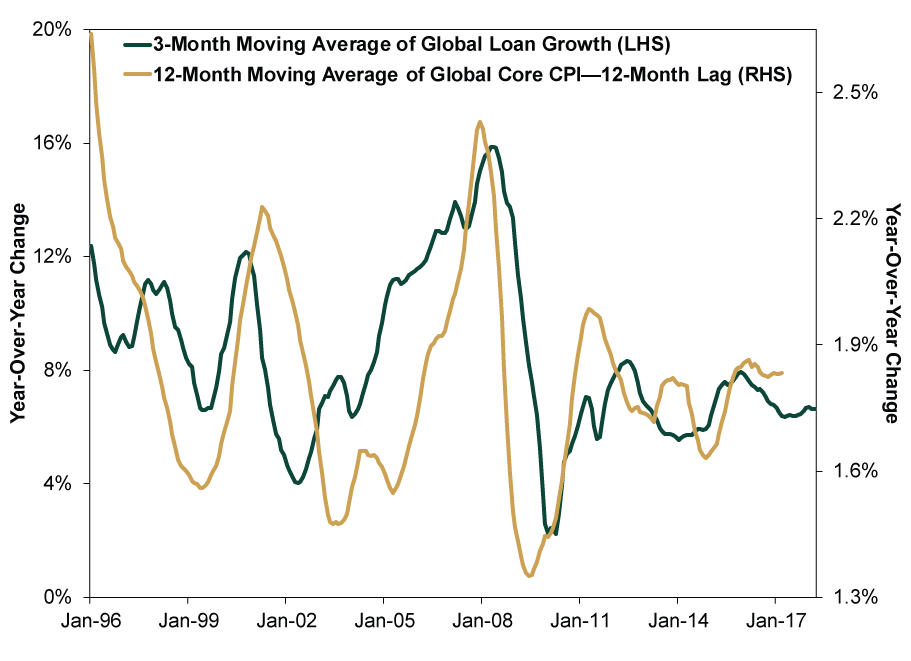
In turn, changes in global money supply tend to follow changes in global bank lending, as banks create the vast majority of money in a fractional reserve banking system (which most major economies have). Hence the strong relationship between global loan growth and global core inflation. Importantly, this isn’t a coincident relationship—as Exhibit 2 shows, loan growth tends to lead inflation by about a year. Global loan growth sped to 6.8% y/y in March—the most recent available data—from 6.5% in February. This is in line with the trend over the last year or so—and slower than loan growth in 2016.
Exhibit 2: Global Loan Growth Leads Global Core Inflation
Source: FactSet, as of 4/26/2018. Year-over-year percentage change in the 3-month moving average of global GDP-weighted loan growth and the 12-month moving average of global CPI, January 1996 – March 2018. Global Core CPI shifted back 12 months.
These global composites are key to understanding the relationship between lending, money supply and inflation. Over the years, many have discounted this relationship—likely because there isn’t one if you look only at US data—preferring to focus on the (antiquated and disproven by Friedman) Phillips Curve model positing a link between unemployment and inflation. Globally, though, there is a strong relationship between money growth and prices—as the above exhibits show. The apparent discrepancy in country-specific data exists because most of the world’s economies are open, with few (if any) barriers to free capital movement. As a result, they are deeply ingrained in global supply and distribution chains—not just domestic happenings. Money always seeks out the highest-value assets and investment opportunities no matter where they reside. Whether between or within companies, sending cash across borders is a breeze. Domestic-only measures miss the resulting fluctuations in worldwide money supply and inflation.
The same logic applies to bank loans: Global companies can get loans in one country and deploy the funds in another—or several. Money supply and inflation in the country the firm took out the loan may not change, but global money supply and inflation eventually do. This is why we also often focus on the global GDP-weighted yield curve—only this accurately captures the global lending environment multinational firms face.
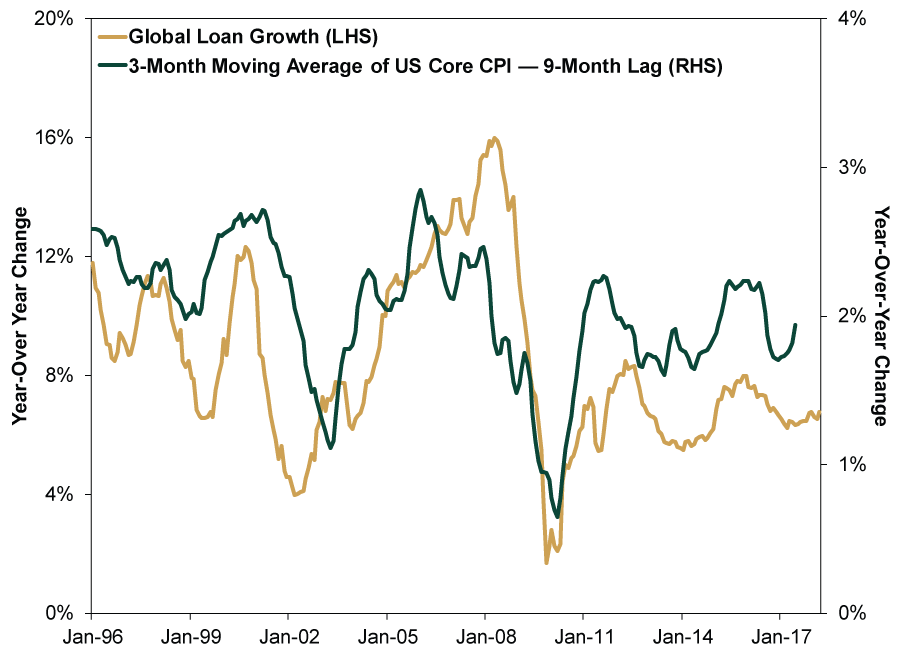
Interestingly, while many seek US-specific reasons for rising US inflation, global lending appears to lead inflation there, too. (Exhibit 3) This shows the power of fundamental global factors even for the world’s largest economy.
Exhibit 3: Global Loan Growth Leads US Core Inflation
Source: FactSet, as of 4/26/2018. Year-over-year percentage change in global GDP-weighted loan growth and the 3-month moving average of US Core CPI, January 1996 – March 2018. US Core CPI shifted back nine months.
Absent a dramatic change in bank lending, inflation is unlikely to materially accelerate in the near future. Most banks around the world are poised to continue lending at a flattish pace, potentially with some modest acceleration in Europe and China. In the former, the potential end of the ECB’s quantitative easing program (which relieves pressure on long rates, potentially allowing the yield curve to steepen) and improving bank balance sheets should help free up more credit. Meanwhile, in China, officials have loosened credit markets a bit in order to offset the tightening effect of earlier efforts to rein in the shadow banking sector. Modest inflation, money supply and economic growth should promote a Goldilocks-type economy, in my view, keeping this expansion—and bull market—running in 2018.
[i] Typically, currency in circulation plus short-term time deposits in banks and 24-hour money market funds.
If you would like to contact the editors responsible for this article, please message MarketMinder directly.
*The content contained in this article represents only the opinions and viewpoints of the Fisher Investments editorial staff.
Get a weekly roundup of our market insights
Sign up for our weekly e-mail newsletter.

You Imagine Your Future. We Help You Get There.
Are you ready to start your journey to a better financial future?

Where Might the Market Go Next?
Confidently tackle the market’s ups and downs with independent research and analysis that tells you where we think stocks are headed—and why.
Related Resources
-
Expert Commentary Why Ken Fisher Is Optimistic About European Stocks
 2026-07-23
 -
Economics A Summertime Check-in on US Consumers2026-07-23
-
Politics Blunting Burnham?2026-07-21
-
Market Analysis Why the SOX “Bear Market” Isn’t Foreboding2026-07-21


Learn More
Learn why 210,000 clients trust us to manage their money and how Fisher Investments and its affiliates may be able to help you achieve your financial goals.
As of 6/30/2026
New to Fisher? Call Us.
Contact Us Today