Personal Wealth Management / Economics
Inside June’s CPI Jump
Once again, a few hot categories skewed the headline inflation rate.

Inflation unexpectedly accelerated in June, leaving economists and pundits from coast to coast scrambling to explain the year-over-year CPI inflation rate’s bump from 5.0% in May to 5.4%.[i] After all, consensus expectations were for a deceleration to 4.9% y/y, and CPI’s rise in June 2020 meant the base effect was less of a factor.[ii] Some coverage found the right culprit: a third consecutive jump in used car prices. Other outlets hit on false scapegoats and, in doing so, showed the perils of not looking deep enough at economic data. But from our vantage point, few if any pundits rightly noted that outside of the narrow categories affected by supply shortages and resurgent post-lockdown demand, we actually saw a fair amount of disinflation for the third straight month. In our view, despite the headline jump, this report strikes us as more evidence accelerating inflation is temporary and investors won’t have to reckon with a 1970s repeat.
Last year’s lockdowns are still upwardly skewing the year-over-year calculation and will for a few more months. Later this year, as the denominator in the year-over-year comp rises more—reflecting the demand bump from last year’s reopenings—it will probably push the annual inflation rate lower. So here, to strip that out, we will focus on the seasonally adjusted month-over-month inflation rate.
That accelerated to 0.9% m/m, defying expectations of 0.5%, which would have been the second straight monthly slowdown.[iii] The biggest single contributor, for the third straight month, was used car and truck prices. Those rose 10.5% m/m, compounding May’s 7.3% and April’s 10.0%.[iv] Transportation services, which includes airfares and car rentals, drove headline prices higher for the third straight month. Hotel accommodations, which shot up 8.8% m/m in April but rose negligibly in May, jumped another 7.9% to contribute almost one-tenth of the headline increase. None of those are terribly surprising, considering all relate to the reopening economy—a combination of tight supply and burgeoning demand. About the only major swing in June was Energy: After detracting from headline inflation slightly in April and May, it made a big contribution in June as gas prices jumped just in time for office workers to rejoin the daily commute and summer travelers to hit the highways. You can see all of this in Exhibit 1.
Exhibit 1: Select Contributions to Headline Month-Over-Month Inflation
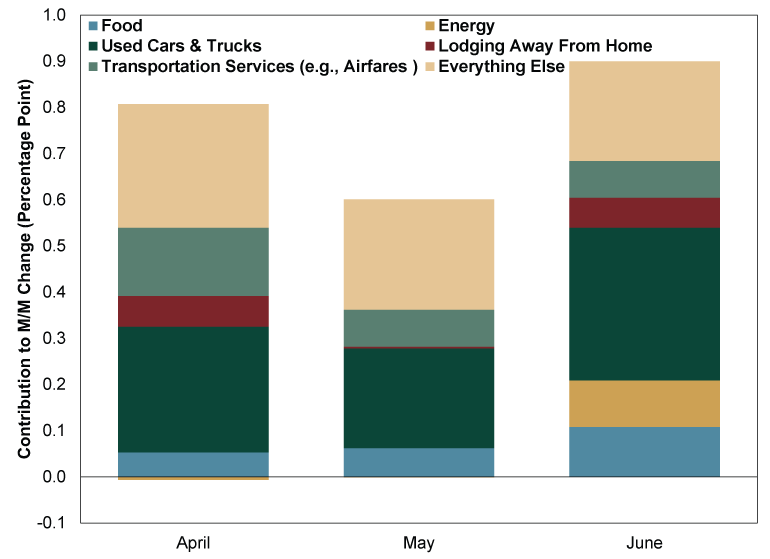
Source: Bureau of Labor Statistics, as of 7/13/2021.
One item that didn’t boost the inflation rate, contrary to what some pundits argued: rent. Yes, we have all seen the anecdotal reports of soaring rent. But anecdotal evidence writ large isn’t valid. The CPI basket doesn’t just include a handful of apartment units—it gathers data nationwide. Accordingly, the component called “rent of primary residence” rose only 0.2% m/m in each of the past three months, contributing less than 20 basis points (0.2 percentage point) to headline monthly inflation each time.
But headlines blamed it anyway because its parent category, “rent of shelter,” accelerated to 0.5% m/m and contributed nearly one-fifth of the total monthly CPI rise.[v] Problem is, that category also includes the aforementioned hotel accommodations. Those were the real culprit, responsible for the vast majority of shelter’s contribution. So those interpreting June’s CPI report as some sort of massive rental boom—and perhaps seeing big dollar signs in REITs as a result—would be advised to always check reporting against the actual data. That is a lesson for all investors.
As for inflation fears, consider Exhibit 2, which shows some of the BLS’s “Special Aggregate Indexes.” These show the inflation rate with various volatile and pandemic-skewed components stripped out. As it shows, when you pull these out, you see disinflation across the rest of the CPI basket.
Exhibit 2: Stripping Away Pandemic Skew
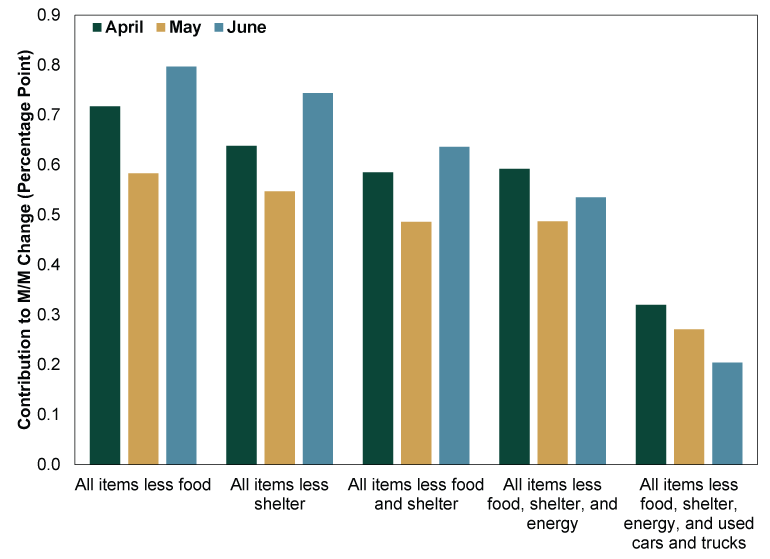
Source: FactSet, as of 7/13/2021.
Note, we aren’t dismissing the headline result or arguing any of these special series are somehow the “correct” inflation rate. Rather, we simply think that last set of columns in particular is a decent gauge—for the time being—of the underlying inflation trend. That is, the trend in prices that one could attribute to the supply of money sloshing around in the economy, rather than those skewed by shortages of parts and labor and one-off demand booms. Simply put, broad money supply can’t create semiconductors and ease the shortage of new cars that has people bidding old jalopies sky-high. Used car prices are therefore a signal of a supply problem, not a too much money in the economy problem. It is the categories outside these big oddities, in our view, that are a better reflection of how money supply is impacting prices broadly. That disinflationary trend, in our view, is what will likely emerge in the headline number as all of these oddities resolve.
If you would like to contact the editors responsible for this article, please message MarketMinder directly.
*The content contained in this article represents only the opinions and viewpoints of the Fisher Investments editorial staff.
Get a weekly roundup of our market insights
Sign up for our weekly e-mail newsletter.

You Imagine Your Future. We Help You Get There.
Are you ready to start your journey to a better financial future?

Where Might the Market Go Next?
Confidently tackle the market’s ups and downs with independent research and analysis that tells you where we think stocks are headed—and why.
Related Resources
-
Market Analysis The New Tariffs in Town Are Still Old News2026-07-24
-
Expert Commentary This Week in Review | Market Volatility, Tariffs, SpaceX
 2026-07-24
 -
Economics A Summertime Check-in on US Consumers2026-07-23
-
Expert Commentary Why Ken Fisher Is Optimistic About European Stocks
 2026-07-23


Learn More
Learn why 210,000 clients trust us to manage their money and how Fisher Investments and its affiliates may be able to help you achieve your financial goals.
As of 6/30/2026
New to Fisher? Call Us.
Contact Us Today