Personal Wealth Management / Market Analysis
Inverted Yield Curves, Recessions and Bears, Oh My!
The yield curve isn’t close to inverting, but even if it did, a downturn wouldn’t necessarily be automatic—or imminent.

Economic data lately have been pretty good! And most forward-looking economic indicators point to growth for the foreseeable future. Yet this hasn’t quelled fears the end is nigh and, among a litany of fears, the go-to financial market gauge bears trot out as evidence seems to be the flattening yield curve. We recently showed why flat yield curve fears are bunk—when properly measured, the yield curve remains positive and supports growth. It is also steep enough to absorb more Fed rate hikes without inverting. But even if the Fed’s tightening campaign persists and overshoots—sending short-term interest rates above long rates—that still doesn’t automatically mean a bear market and recession are imminent.
Exhibit 1: Yield Curve Inversions Usually Precede Bear Markets
Source: Federal Reserve Bank of St. Louis, as of 7/19/2018. The yield curve spread is the 10-year Treasury yield minus the effective fed-funds rate, 1/2/1968 – 7/18/2018.
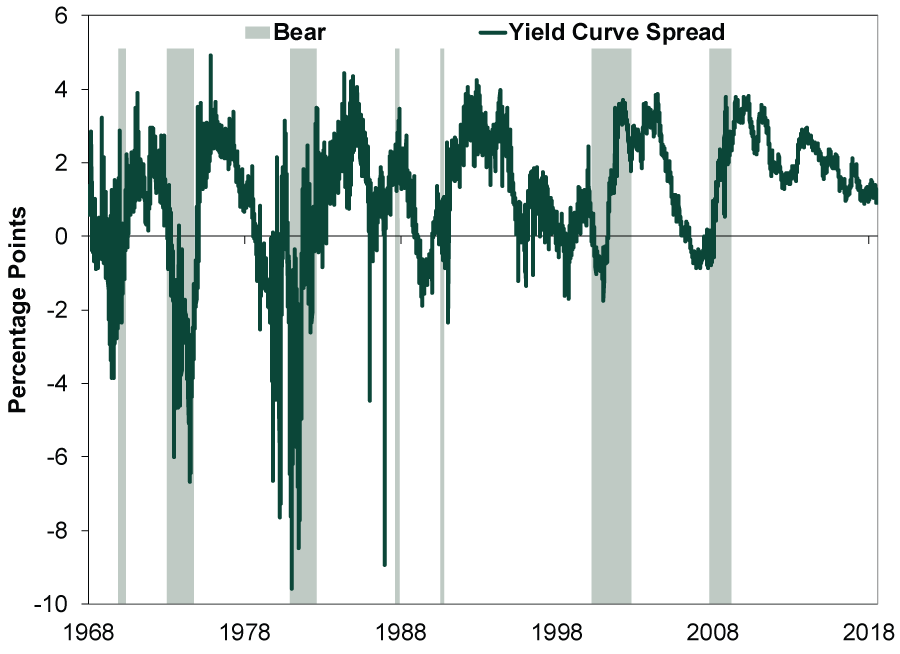
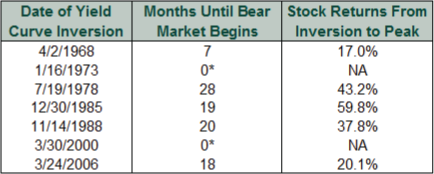
As Exhibit 1 shows, there have been 7 bear markets (shaded areas)—fundamentally driven declines of -20% or more—over the last 50 years.[i] But while it is important to take note of yield curve inversions, it is also worth noting bear markets usually don’t immediately follow. In all but two cases, stocks continued climbing after inversion. As Exhibit 2 shows, bull markets typically continue for quite a few months after inversion, with stocks rising substantially from the initial inversion date to the stock market’s peak.
Exhibit 2: Yield Curve Inversion Is No Timing Tool
Source: Federal Reserve Bank of St. Louis and Global Financial Data, Inc., as of 7/19/2018. Yield curve inversion results when the 10-year Treasury yield minus the effective fed-funds rate is negative. Stock returns calculated using S&P 500 daily price data from inversion date to subsequent bull market peak. *The 1973 bear started three trading days before the yield curve inverted. The 2000 bear started four trading days before.
There are also some false signals. Like the quip “the stock market has forecast nine of the last five recessions,”[ii] yield curve inversions often foretell bears—or are at least concurrent—but bears don’t always follow. The yield curve sometimes inverts (like in 1998 or 1995), only to flip back without a big downturn. Taking these signals too literally—getting defensive the first time short rates top long—can be costly. Investors would have missed spectacular gains. The Fed could react correctly, too! In the mid-1990s, for example, they subsequently lowered rates enough to extend the bull and economic expansion. Inverting and staying inverted is what matters.
The lesson isn’t to blindly follow or ignore the yield curve, but to understand why it isn’t a timing tool. Yield curve inversion is essentially a monetary policy change. Monetary policy hits the economy at a lag. Since banks borrow short, lend long and pocket the difference, the yield curve is a proxy for banks’ profitability. If the yield curve inverts—and stays there—then banks would basically lose money on any new loans, so lending freezes. Not immediately, as banks may initially try to ride out the storm, but if it persists, firms can’t access capital and the economy stalls. The lag gives you time to assess whether inversion is a blip or a trend.
For now, with about a percentage point between short and long rates, the yield curve isn’t close to inversion. Worrying about a recession and bear market because the yield curve might invert later is not only premature, but folly for investors, as they could miss big returns between inversion and peak. But we aren’t even there yet. With the yield curve still positive, expect economic expansion—and the bull market—to extend a good while longer.
[i] S&P 500 bear market (peak-to-trough) dates using daily closing price data. They are: 11/29/1968 – 5/26/1970; 1/11/1973 – 10/3/1974; 11/28/1980 – 8/12/1982; 8/25/1987 – 12/4/1987; 7/16/1990 – 10/11/1990; 3/24/2000 – 10/9/2002; and 10/9/2007 – 3/9/2009.
[ii] Courtesy of Nobel prize winning economist Paul Samuelson (1966).
If you would like to contact the editors responsible for this article, please message MarketMinder directly.
*The content contained in this article represents only the opinions and viewpoints of the Fisher Investments editorial staff.
Get a weekly roundup of our market insights
Sign up for our weekly e-mail newsletter.

You Imagine Your Future. We Help You Get There.
Are you ready to start your journey to a better financial future?

Where Might the Market Go Next?
Confidently tackle the market’s ups and downs with independent research and analysis that tells you where we think stocks are headed—and why.
Related Resources
-
Politics Blunting Burnham?2026-07-21
-
Market Analysis Why the SOX “Bear Market” Isn’t Foreboding2026-07-21
-
Expert Commentary 3 Things You Need to Know This Week | Q2 Earnings, ECB Meeting, Trump Accounts
 2026-07-20
 -
Weekly Wrap-Up Fisher Investments Reviews: Last Week in Markets—July 13 - July 172026-07-20


Learn More
Learn why 210,000 clients trust us to manage their money and how Fisher Investments and its affiliates may be able to help you achieve your financial goals.
As of 6/30/2026
New to Fisher? Call Us.
Contact Us Today