Personal Wealth Management / Economics
January Pointed Positively for the US Economy
Rounding up the latest—and largely overshadowed—positive US economic data.

In some non-Russia-Ukraine financial news, January numbers came out for several widely watched US economic datasets last Friday. Despite worries ranging from rising prices to Omicron, the results largely exceeded expectations. January’s growthy figures suggest the US economy is on solid footing and remains more resilient than many appreciate—useful perspective given all of today’s alleged economic headwinds.
The latest personal consumption expenditures (PCE) price data led most headlines, as the Bureau of Economic Analysis’s (BEA’s) headline price index is the Fed’s preferred gauge. That measure rose 6.1% y/y in January, its fastest rate since 1982.[i] The “core” PCE price index (which excludes volatile food and energy prices) accomplished a similar feat, rising 5.2% y/y—its quickest pace since 1983.[ii] On a monthly basis, the PCE price index climbed 0.6%, in line with its growth rate over the past three months.[iii] Now, the BEA’s price data don’t reveal much new since other gauges, including January’s CPI and PPI, paint a similar picture.
However, the BEA did find January consumer spending held up despite rising prices. January retail sales (3.8% m/m) hinted at this, though some questions remained. The Census Bureau doesn’t apply inflation adjustments to retail sales, and retail trade doesn’t include most services spending, which comprise the lion’s share of household expenditures.[iv] PCE rounds out the picture. January’s real (i.e., inflation-adjusted) PCE rose 1.5% m/m, with goods spending (4.3%) stronger than services (0.1%).[v] The split isn’t a big surprise, given the Omicron variant kept workers and consumers home. That weighed on people-facing services industries in particular, including restaurants and bars (-1.3% m/m), hotels and motels (-3.5%) and air travel (-0.9%).[vi] While one month of data, positive or negative, doesn’t make a trend, growth in the face of higher prices reveals strong consumer demand—and counters worries elevated prices are an automatic negative for a large swath of US economic activity.
January’s personal savings rate drop from December’s 8.2% to 6.4%—the lowest since 2013—also grabbed eyeballs.[vii] That spurred concerns the COVID-driven savings boom may be ending—which could have implications for consumer spending. However, fretting over the savings rate’s economic impact seems misplaced, in our view. Consider some methodology quirks in determining the personal savings rate, which the BEA defines as the percentage of people’s disposable income they save after taxes and personal spending. However, the BEA doesn’t count realized capital gains (which result from selling an investment at a higher price than what you paid for it) as income even though capital gains taxes subtract. Since many people—particularly retirees—use invested savings and realize capital gains to meet cash flow needs, the official savings rate likely understates actual savings, in our view. Moreover, the dip in January’s number was likely tied partially to a one-time factor: the expiration of monthly Child Tax Credit payments.
The savings rate also doesn’t predict consumer spending, as some recent history illustrates. From January 2015 – January 2020, the monthly personal savings rate averaged 7.4% while consumer spending climbed.[viii] (Exhibit 1) In early 2020, the savings rate spiked and consumer spending plummeted—both due to the first COVID lockdown. While COVID-related skew left the past 25 months looking wonky, both measures appear to be returning to their pre-pandemic trends. Savings and consumer spending may move in opposite directions at times—particularly during recessions and stretches of economic stress—but the historical record doesn’t support the notion the savings rate foretells consumption.
Exhibit 1: The Personal Savings Rate and Consumer Spending, January 2015 – January 2022
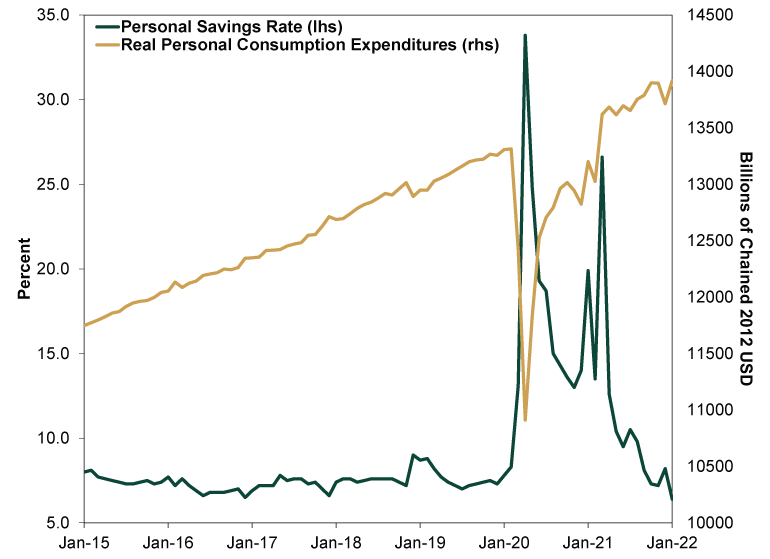
Source: St. Louis Federal Reserve, as of 2/28/2022. US personal savings rate and real personal consumption expenditures in billions of chained 2012 US dollars at seasonally adjusted annual rates, January 2015 – January 2022.
Rounding out the latest US economic data, January durable goods orders rose 1.6% m/m, well ahead of expectations of 0.7%.[ix] Widely watched nondefense capital goods orders, excluding aircraft, (also referred to as core capital goods orders) rose 0.9% m/m, continuing a positive streak starting in March 2021.[x] Many economists treat core capital goods orders (think computer equipment or industrial machinery) as a proxy for business investment, which is often the swing factor for GDP. Yet capital goods are just one part of business investment, which also includes software, research & development, and structure spending. Though core capital goods orders can shed some insight on a segment of business spending, it isn’t necessarily a leading indicator for the broader economy. Now, focusing on orders alone risks overlooking production issues, especially since many companies still face supply-related headwinds, from shortages to bottlenecks. But new orders’ growth over the past 10 months indicates capital spending’s resiliency—a sign of strong domestic demand.
As with most widely watched economic measures, these data confirm what recently happened—old news to forward-looking stocks. But given the rampant worries over economic headwinds from inflation to geopolitical conflict, solid growth out of the world’s largest economy offers a reminder that the global bull market stands on firm fundamental footing.
[i] Source: Bureau of Economic Analysis, as of 2/28/2022. “Personal Income and Outlays, January 2022.”
[ii] Ibid.
[iii] Ibid.
[iv] Source: BEA, as of 3/1/2022.
[v] See note i.
[vi] Ibid.
[vii] Ibid.
[viii] Source: St. Louis Federal Reserve, as of 2/28/2022. Personal Savings Rate, January 2015 – January 2020.
[ix] Source: FactSet, as of 2/28/2022.
[x] Ibid.
If you would like to contact the editors responsible for this article, please message MarketMinder directly.
*The content contained in this article represents only the opinions and viewpoints of the Fisher Investments editorial staff.
Get a weekly roundup of our market insights
Sign up for our weekly e-mail newsletter.

You Imagine Your Future. We Help You Get There.
Are you ready to start your journey to a better financial future?

Where Might the Market Go Next?
Confidently tackle the market’s ups and downs with independent research and analysis that tells you where we think stocks are headed—and why.
Related Resources
-
Economics Q2 US GDP’s Stealthy Strength2026-07-31
-
Expert Commentary This Week in Review | Fed Meeting, US GDP, Eurozone GDP
 2026-07-31
 -
Market Analysis Don’t Fret the EU’s Low Summertime Gas Storage Levels2026-07-31
-
Economics On Fires and GDP2026-07-30


Learn More
Learn why 210,000 clients trust us to manage their money and how Fisher Investments and its affiliates may be able to help you achieve your financial goals.
As of 6/30/2026
New to Fisher? Call Us.
Contact Us Today