Personal Wealth Management / Interesting Market History
Lessons From America’s Decade-Old Downgrade
Markets care about a lot of things. Credit ratings aren’t one of them.

10 years ago today, Standard & Poor’s made a $2.1 trillion math error, fought with the Treasury for several hours, then downgraded America’s credit rating from AAA to AA+. Not because America’s debt was problematic, but because they didn’t like how politicians were squabbling over the debt ceiling. They thought it would undermine the stability of America’s debt and scare off investors. Headlines globally agreed, warning debt costs would soar absent the AAA rating. How wrong they were. Yields fell in the immediate aftermath … and kept on falling. Over the next few years, debt got more affordable as buyers competed to own the world’s deepest, most liquid government asset. If ever you needed proof that credit ratings are inconsequential to markets, the events of a decade ago are required reading.
S&P’s original press release, which is archived in full here, is a tour de force in rhetorical gymnastics and grasping at straws. Early drafts focused on deficit projections. But the corrected math error negated that line of reasoning, so the final draft focused on politics. It had a little bit on the “sequestration” budget cuts and a whoooooooooole lot on the debt ceiling standoff, which took up most of the word count. We guess they had to do something to heighten the drama since their headline debt-to-GDP forecast was a rather tame 78% by 2021 and they had to justify downgrading the US while keeping other nations whose present debt exceeded that long-term forecast at AAA. To that end, they cooked up an entertaining “downside scenario” purporting to show how a second downgrade could jack debt up to 101% of GDP by 2021’s end instead—amusingly, roughly in line with their pre-math-flub forecast. Combine that flight of fancy with “the political brinksmanship” making financial policy “less stable, less effective and less predictable,” and you get a downgrade.
Now, we have always enjoyed poking fun at long-term forecasts’ notorious inaccuracy, but here is the funny thing about all of this: S&P was right! They lamented that “the statutory debt ceiling and the threat of default have become political bargaining chips.” Our elected representatives have doubled down on that tactic over the last decade. As for debt projections, they shoulda stuck with that math error! It was far closer to reality! Before Treasury Official John Bellows pointed out their “basic math error of significant consequence,” S&P estimated net Federal, State and Local Government Debt would be closing in on 100% of GDP by this year’s end.[i] Folks, that was too optimistic! Net federal debt alone finished Q1 at 99.9% of GDP.[ii] Add in state and local, and you get well over 100%. Granted, it took a totally unforeseeable pandemic and astronomical fiscal response to get there, but still. What gives? Why hasn’t Uncle Sam gotten a few more downgrade notches?
All Most kidding aside, even the headline GDP forecast turned out to be pretty spot on. Before the pandemic skew set in, debt finished 2019 at 79.2%, in line with that 78%.[iii] The debt ceiling standoff is repeating as we type, and the threat of default is again a bargaining chip—as it has been numerous times over the past decade.
But, critically, bond markets are fine. Interest rates didn’t soar. Actually, as Exhibit 1 shows, they fell in the downgrade’s wake. Then they bounced around and spent most of the next decade below pre-downgrade levels. They remain there today. So much for a radical rethinking of how investors would price Uncle Sam’s credit risk.
Exhibit 1: Interest Rates Went Down, Not Up
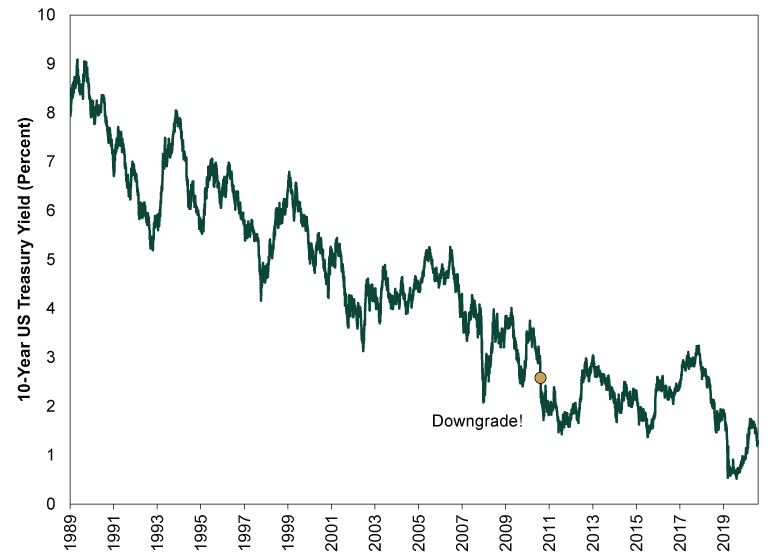
Source: FactSet, as of 7/30/2021. 10-Year US Treasury Yield (Constant Maturity), 12/31/1989 – 7/30/2021.
Bond prices, which move inversely to interest rates, are a function of supply and demand. So it is quite notable that this long-term bond price increase accompanied a rather sizable supply increase. In absolute terms, debt has more than doubled since the downgrade. (Exhibit 2) That is a lot of new sales to finance! But the Treasury never had problems finding an audience. Auctions were routinely oversubscribed at all maturities. People are still lining up to buy US debt now, even with its AA+ rating and increased supply.
Exhibit 2: US Debt Still Found Plenty of Buyers
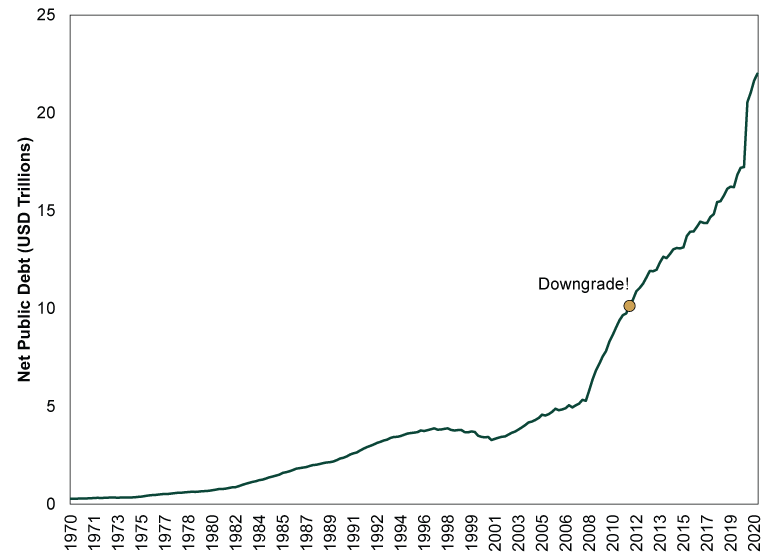
Source: St. Louis Fed, as of 7/30/2021. Total US Debt Held by the Public, Q1 1970 – Q1 2021.
Thanks to strong demand and falling interest rates, even as debt has ballooned, it has become overall more affordable since the downgrade—utterly destroying the logic behind S&P’s move. Not only is the average interest rate on all US debt (read: every maturity) far below where it was a decade ago (Exhibit 3), but debt service costs fell relative to tax revenues for years after the downgrade (Exhibit 4). Interest costs as a percentage of tax revenues are higher now than in 2011, but that is also down to the COVID response, not a rapid shift in market fundamentals. Plus, even with that recent increase, debt is still more affordable than it was in most of the 1980s and 1990s. Do you remember the great Reagan-era or Clinton-era debt crisis? Neither do we.
Exhibit 3: Debt Got Cheaper Post-Downgrade …
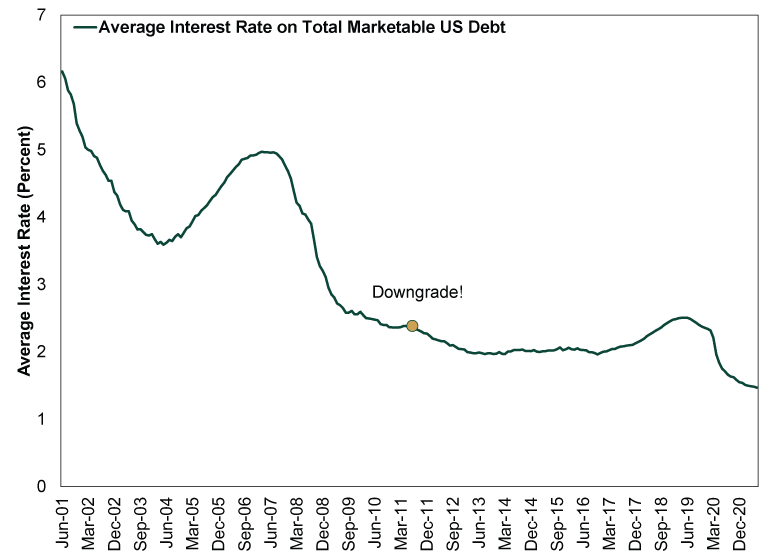
Source: US Treasury, as of 7/30/2021. Average Interest Rate on Total Marketable US Debt, June 2001 – June 2021.
Exhibit 4: … and More Affordable
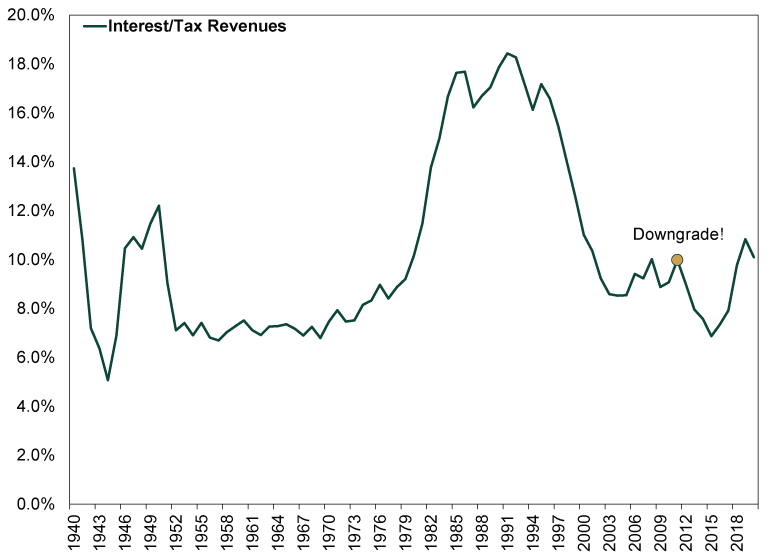
Source: St. Louis Fed, as of 7/30/2021. Annual federal interest payments and tax receipts (fiscal year), 1940 – 2020.
The credit rating downgrade is yet another thing, like 2013’s taper tantrum, that people remember as some monumentally huge event. The obvious truth that life went on and things went fine even though S&P never bothered upgrading its rating is a footnote at best in most coverage. And mentioning that debt got cheaper after the downgrade? Fuhgeddaboudit. But to us, the most shocking thing is that people still pay attention to the nationally recognized statistical ratings organizations. Even after the math error. Even after reality proved the downgrade was feckless. Even as the UK proved that point again following its own 2012 downgrade. Even as well-documented conflicts of interest in the issuer pays model threw every corporate credit rating in doubt. And and and. Yet somehow, the ratings cult survives.
We suggested tuning the raters out 10 years ago and will continue reiterating that message as long as we need to. When ratings aren’t based on forecasts and math errors, they cite well-known issues and backward-looking data. In other words, things markets already knew. The market, which incorporates every investor on earth’s viewpoint, is the best risk pricing mechanism there is. It has spent the last decade telling anyone who would listen that S&P’s downgrade didn’t matter. Now it tells you debt remains far from problematic even at today’s elevated levels. We would humbly suggest tuning markets in—and tuning pundits and ratings agencies out.
If you would like to contact the editors responsible for this article, please message MarketMinder directly.
*The content contained in this article represents only the opinions and viewpoints of the Fisher Investments editorial staff.
Get a weekly roundup of our market insights
Sign up for our weekly e-mail newsletter.

You Imagine Your Future. We Help You Get There.
Are you ready to start your journey to a better financial future?

Where Might the Market Go Next?
Confidently tackle the market’s ups and downs with independent research and analysis that tells you where we think stocks are headed—and why.
Related Resources
-
Market Analysis The New Tariffs in Town Are Still Old News2026-07-24
-
Expert Commentary This Week in Review | Market Volatility, Tariffs, SpaceX
 2026-07-24
 -
Economics A Summertime Check-in on US Consumers2026-07-23
-
Expert Commentary Why Ken Fisher Is Optimistic About European Stocks
 2026-07-23


Learn More
Learn why 210,000 clients trust us to manage their money and how Fisher Investments and its affiliates may be able to help you achieve your financial goals.
As of 6/30/2026
New to Fisher? Call Us.
Contact Us Today