Personal Wealth Management / Market Analysis
One Valuation Tool’s Extreme Backwards Bias, Revealed
Digging into the math underlying the cyclically adjusted price-to-earnings ratio shows its huge backward skew tied to events long since over.

High valuations are a common concern among investors lately, with many touting the Shiller P/E (or Cyclically Adjusted Price-to-Earnings ratio, CAPE) as particularly concerning. At 31.3, most commentary on the subject highlights the factoid this level has occurred only twice before in history: The late 1990s and 1929, which many claim suggests trouble looms. Yet here is the thing: CAPE is a broken indicator, and the math underlying it can help you see why.
Stocks look forward, but valuation measures are backward looking, to varying degrees. Forward 12-month price-to-earnings ratios (P/Es) are based on analysts’ earnings forecasts—projections made at a particular point in time. Trailing 12-month P/Es are based on past quarters’ results. CAPE, however, is far worse: In an effort to smooth earnings and get a longer view, it averages together a decade’s results (adjusted for inflation). As we have often noted on these pages, that means events from many years ago—like the Financial Crisis, presently—impact CAPE. But, of course, an event ending eight and a half years ago isn’t relevant to where stocks head in 2017 and beyond. It is over.
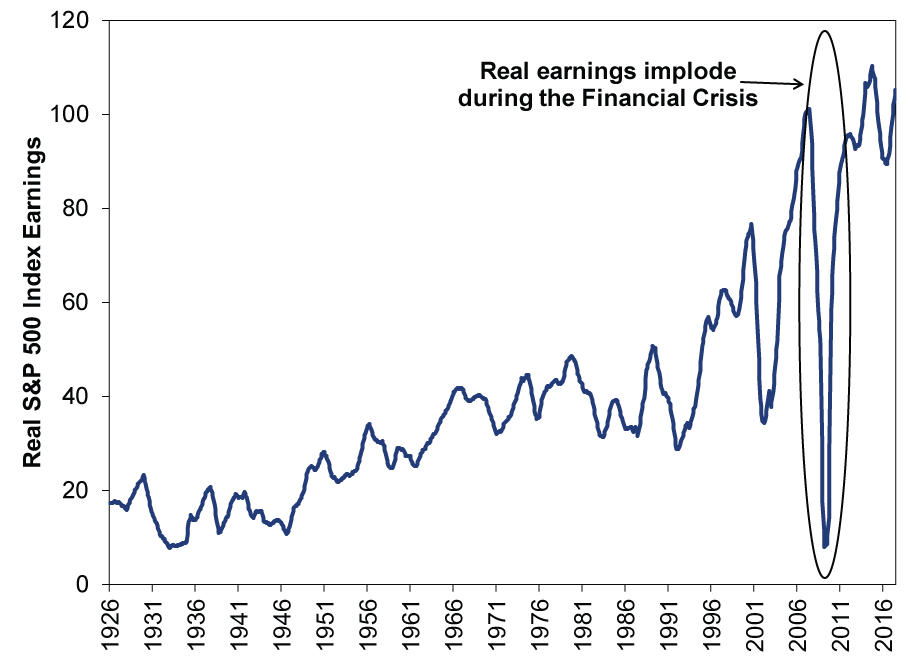
Yet CAPE is still inflated by the crisis. Exhibit 1 shows why, plotting the raw data behind the CAPE’s divisor—real earnings. The 2007 – 2008 crisis jumps off the page. We’ve circled it here, although we doubt it was necessary.
Exhibit 1: Real Earnings Squashed Nine Years Ago
Source: Prof. Robert Shiller, https://www.econ.yale.edu/~shiller/data.htm. Accessed 11/21/2017. January 1926 – November 2017 (estimated). Data are monthly.
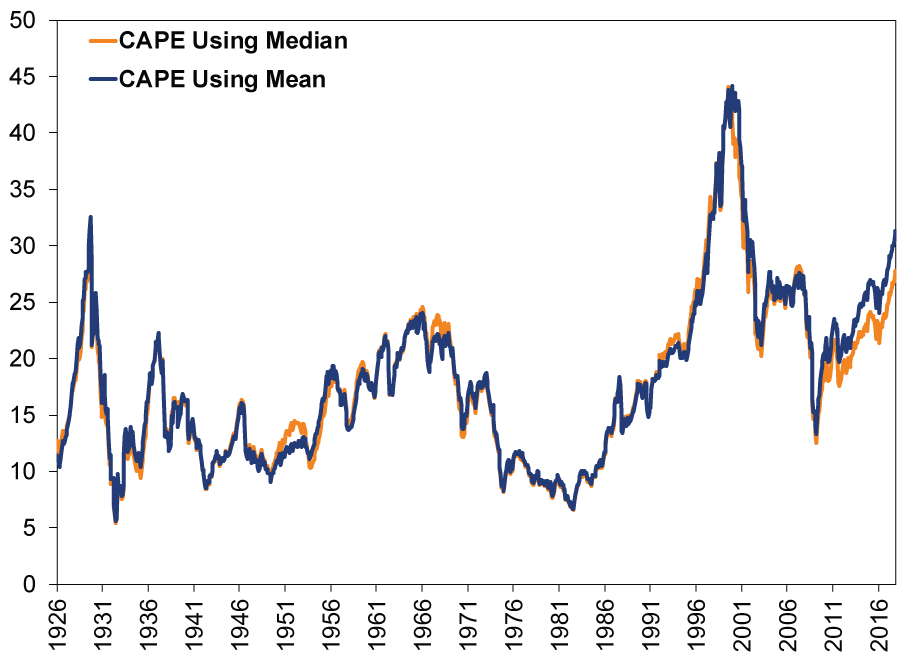
As an astute article in The Wall Street Journal noted today: To smooth the data, CAPE uses a mean[i]—a simple average—of these earnings over 10 years. Anyone familiar with averages likely sees a problem here: That big drop in earnings is going to cause significant downward skew as long as it is in the dataset. When it falls out, all else equal, CAPE will fall. You can actually see this now, as the Journal noted, by simply using median[ii] real earnings over the same period. If you do so, you’ll find CAPE falls almost four points to 27.7.
Exhibit 2: Median S&P 500 CAPE Versus Mean S&P 500 CAPE
Source: Prof. Robert Shiller, https://www.econ.yale.edu/~shiller/data.htm. Accessed 11/21/2017. January 1926 – November 2017 (estimated). Data are monthly.
None of this is to say 27.7 is a more “correct” level of CAPE or that other P/Es are predictive. We don’t believe any of them are. However, we think this does highlight how backward looking CAPE is. Just remember that next time you read someone arguing CAPE spells trouble ahead.
[i] A mean sums up all the observations and then divides by the number of observations. It is not mean in the angry sense of the term, at least as far as we are aware.
[ii] A median is the middle number; the point at which there are an equal number of observations above and below in the dataset.
If you would like to contact the editors responsible for this article, please message MarketMinder directly.
*The content contained in this article represents only the opinions and viewpoints of the Fisher Investments editorial staff.
Get a weekly roundup of our market insights
Sign up for our weekly e-mail newsletter.

You Imagine Your Future. We Help You Get There.
Are you ready to start your journey to a better financial future?

Where Might the Market Go Next?
Confidently tackle the market’s ups and downs with independent research and analysis that tells you where we think stocks are headed—and why.
Related Resources
-
Market Analysis Why the SOX “Bear Market” Isn’t Foreboding2026-07-21
-
Politics Blunting Burnham?2026-07-21
-
Expert Commentary 3 Things You Need to Know This Week | Q2 Earnings, ECB Meeting, Trump Accounts
 2026-07-20
 -
Weekly Wrap-Up Fisher Investments Reviews: Last Week in Markets—July 13 - July 172026-07-20


Learn More
Learn why 210,000 clients trust us to manage their money and how Fisher Investments and its affiliates may be able to help you achieve your financial goals.
As of 6/30/2026
New to Fisher? Call Us.
Contact Us Today