Personal Wealth Management / Market Analysis
Quick Hit: July US and UK Retail Sales
More evidence the global expansion remains in better shape than appreciated.

After last week’s market turbulence, US and UK consumers seemed to provide a reprieve. July retail sales for both countries rose, and headlines heralded consumers as a bright spot in a stormy global economy—though pundits still fretted manufacturing weakness eventually spilling over. While retail sales don’t capture all of consumer spending, the latest numbers add further evidence that the non-industrial parts of the US and UK economies, which happen to represent the majority of GDP, are faring fine.
Stateside, July retail sales grew 0.7% m/m (3.5% y/y). Across the pond, they rose 0.2% m/m (3.3% y/y). Both beat expectations (for 0.3% in the US, -0.3% in the UK). While headlines cheered the growthy July, these summertime figures aren’t out of line with retail sales’ expansionary 2019.
Exhibit 1: US Retail Sales
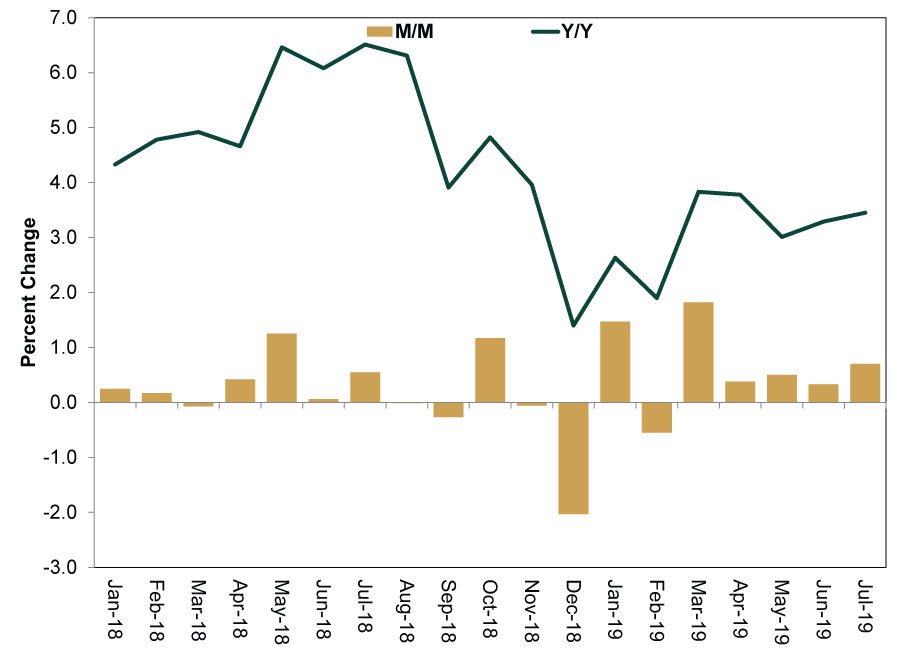
Source: FactSet, as of 8/16/2019. Percent change in US retail sales on a month-over-month and year-over-year basis, January 2018 – July 2019.
Exhibit 2: UK Retail Sales

Source: FactSet, as of 8/16/2019. Percent change in UK retail sales on a month-over-month and year-over-year basis, January 2018 – July 2019.
Some noted how one giant Internet retailer’s arbitrary promotional day may have primed the pump for a strong July. Non-store retail sales rose 2.8% m/m in the US, accelerating from June’s 1.9%. The category fared even better in the UK, speeding from June’s 0.6% m/m to 6.9%. While we don’t dismiss the positives, non-store retailing comprises a small slice of total retail. The category accounts for about 13% of July’s total US retail sales.[i] In the UK, non-store retail makes up about 10% of total retail.[ii]
Less appreciated, in our view: how broad based growth was. In the US, only three categories contracted: motor vehicle & parts dealers, health & personal care stores, and sporting goods, hobby, musical instrument & book stores. In the UK, while non-food stores took a hit—detracting 0.6 percentage point from growth—much-maligned department stores rose, snapping a six-month losing streak.
July’s UK retail sales in particular provided a timely reminder to not blindly accept headlines’ doomsday warnings. Near August’s start, the British Retail Consortium announced retailers suffered “the worst month for sales in July since records began.” Besides the fact they reported total July sales rose 0.3% y/y, math explains why the gloomy assessment was off. The “worst read on record” wasn’t because July sales were weak—rather, they had to contend with a high base effect. Warm weather and last year’s World Cup buoyed July 2018 sales, setting an inflated comparison point for this year. That sales were still positive on a year-over-year basis despite this illustrates retail sales’ continued strength.
Moreover, recent trends provide better context, as year-old skew tells you little meaningful about today. The ONS’s official July estimate was 3.3% y/y, but on a monthly basis, UK retail sales rose in five of 2019’s seven completed months. March’s surge and April and May’s pullbacks likely reflect the Brexit deadline’s shift from the end of March to Halloween, which pulled demand forward as consumers tried to front-run the original deadline—only to be left with unnecessary stockpiles when it moved. While backward-looking data don’t tell the future, more recent retail sales suggest UK consumers have been faring fine despite the Brexit saga’s many twists and turns.
We aren’t saying retail sales tell you everything about personal consumption—especially since they exclude most services spending, which outweighs goods. But they do reinforce the notion things are better than many pundits seem to think.
[i] Source: US Census Bureau, as of 8/19/2019.
[ii] Source: Office for National Statistics, as of 8/19/2019.
If you would like to contact the editors responsible for this article, please message MarketMinder directly.
*The content contained in this article represents only the opinions and viewpoints of the Fisher Investments editorial staff.
Get a weekly roundup of our market insights
Sign up for our weekly e-mail newsletter.

You Imagine Your Future. We Help You Get There.
Are you ready to start your journey to a better financial future?

Where Might the Market Go Next?
Confidently tackle the market’s ups and downs with independent research and analysis that tells you where we think stocks are headed—and why.
Related Resources
-
Market Analysis The Golden Paradox2026-03-24
-
In The News How investors should think about oil and stocks in the Iran war – in 3 simple steps2026-03-23
-
Weekly Wrap-Up Fisher Investments Reviews: Last Week in Markets—March 16 - March 202026-03-23
-
Expert Commentary PMIs, Denmark Snap Election, Tax Season | 3 Things You Need to Know This Week2026-03-23


Learn More
Learn why 195,000 clients trust us to manage their money and how Fisher Investments and its affiliates may be able to help you achieve your financial goals.
As of 12/31/2025
New to Fisher? Call Us.
Contact Us Today