Personal Wealth Management / Market Analysis
The Complicated Reality of Those Inflation-and-Stock-Return Analyses
We crunched a lot—and we mean a lot—of numbers on inflation and stocks.

Throughout 2021’s great inflation scare, we have seen a few pieces arguing stocks will disappoint investors hoping their returns will outpace accelerating consumer prices. Some use rhetoric, arguing rising input costs will zap corporate earnings (and, in our view, ignoring that companies can raise prices of whatever goods and services they sell, preserving margins). Others purport to support their case with data showing a strong link between “rising inflation,” whatever that even means, and weak stock returns. But we have yet to see any show their math or data in transparent detail. There are embedded assumptions in every single one we have seen, and absent that transparency, you can’t really judge the accuracy. So to help you out, we ran a bunch of numbers. As we will show you, they suggest stocks do well in inflationary environments more often than not.
The most recent article that caught our eye on this front was in The Wall Street Journal last week. Citing a study from a UK asset management firm, it stated that “from early 1973 through last December, stocks have delivered positive inflation-adjusted returns in 90% of rolling 12-month periods that occurred when inflation—as measured by the consumer-price index—was below 3% and rising … But that fell to only 48% of the periods when inflation was above 3% and rising.”[i]
Upon reading this, we had a host of questions. Why start in 1973, considering the inflation everyone associates with the 1970s started in the late 1960s? What constitutes “rising inflation”—if CPI jumps one month, slows the next, then inches higher, is that in the dataset? Why exclude periods of decelerating double-digit inflation—don’t people still worry about fast-rising prices eroding their purchasing power in that environment, too? Alas, we nosed around, looked up reports, watched videos and found little that provided an answer.
The main problem with this and other outlets’ attempts to illuminate inflation’s stock market impact is that, depending on the criteria you use, the results can differ wildly. This is partly because inflation rates aren’t fixed. They fluctuate wildly, and periods of high inflation can last a long while. Therefore, if you take the forward stock returns from every month where the CPI inflation rate breached 3% y/y, 4%, 5% or what have you, you will inevitably have a lot of double-counting. But if you just go from the beginning of an inflationary stretch, taking the first year or so of returns, you will inevitably miss problems that materialize later.
Nowhere is this more clear than in the late 1960s and 1970s. Back then, the CPI inflation rate crossed above 5% y/y in August 1966, and it stayed above that threshold for 234 months. It spent a chunk of that time over 10%. That stretch included three bear markets (1968 – 1970, 1973 – 1974 and 1980 – 1982). But using only the beginning of that period, for the sake of avoiding double counting, would show big forward 6- and 12-month returns. That is an interesting data point, but it doesn’t tell the full story.
So when we crunched the numbers, we shunned convention and decided to double count the heck out of everything. We found every month where CPI inflation rate was above 3% y/y, 4% or 5% since good stock market data begin in 1925, and we grabbed the S&P 500’s corresponding returns over the next 6, 12 and 18 months. We didn’t add filters and arbitrary definitions for fuzzy concepts like “rising inflation.” We didn’t lump anything into a subjective category like “inflationary period.” We learned to stop worrying and love the overlapping results. And then we averaged them out, as you will see in Exhibit 1.
Exhibit 1: A Long History of Inflation and Forward Stock Returns
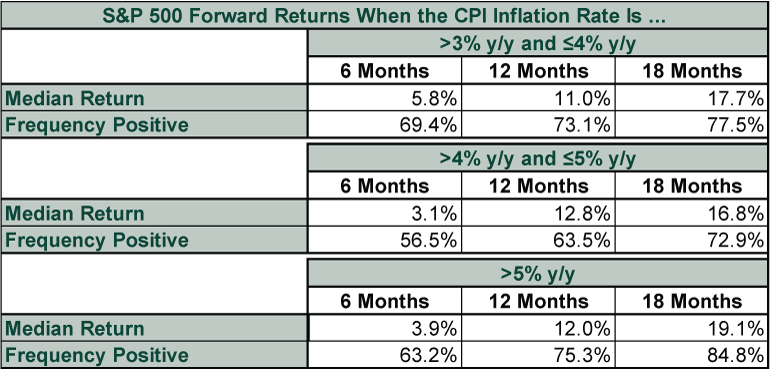
Source: Global Financial Data, Inc. and US Bureau of Labor Statistics, as of 5/27/2021. S&P 500 total return index, 12/31/1925 – 4/30/2021. HT: Fisher Investments Research Associate Chloe Butler.
All of the average return figures above are positive, which indicates higher-than-usual inflation isn’t inherently negative. Yet in some cases, the frequency of positive returns is below stocks’ long-term average frequency of positivity (around 75% over all rolling 12-month periods), making it an error to outright dismiss inflation as a market risk.[ii] Even in those six-month forward return windows, where the frequency of positivity is lowest, there could be overlap with a bear market. So, we think it is beneficial to go deeper, assess where those negative returns cluster, and see what we can learn.
One big cluster was 1937, when the Fed truncated the recovery from the early-1930s bear market by jacking up reserve requirements, which wrecked lending and economic growth and, in our view, triggered a new bear market. A smaller cluster followed in 1941, as markets reckoned with the likelihood of the US entering World War II. Next up is 1968 – 1969, when the Fed inverted the yield curve in hopes of containing price increases. Then, 1973 – 1974, when the Nixon administration monkeyed with price controls to disastrous effect. Another small, non-bear market cluster arrived in parts of 1976 and 1977, when high inflation wasn’t new but the Carter administration was, spooking investors with a unified Democratic government and the potential for big legislation. The next big negative swath, 1980 – 1982, accompanied former Fed head Paul Volcker’s ultimately successful attempt to finally tame the inflation beast with sky-high interest rates. That, too, inverted the yield curve deeply and brought a long recession. Lastly, there are the negative returns accompanying higher inflation in late 2007 and 2008, when fast-rising oil prices were merely part of the backdrop as FAS 157 (the mark-to-market accounting rule) did its worst to bank balance sheets.
We think this all illustrates a key point: Inflation, on its own, isn’t inherently problematic for stocks. Rather, the trouble manifests when the Fed or government does something counterproductive in the name of fighting inflation. Or, when another, unrelated negative wallops an expansion before that happens, like WWII’s onset and the application of mark-to-market accounting to illiquid, hard-to-value assets that banks never intended to sell. Until a wallop or monetary policy error arrives, stocks can and have delivered very nice returns during periods of higher inflation, helping investors who stay disciplined maintain their purchasing power.
Therefore, if it turns out that we are wrong in thinking the current bout of higher inflation is only temporary, and the CPI inflation rate creeps higher and stays there, we don’t think that is likely to be reason enough to sour on stocks. Rather, we think it is a call to critically assess whether there are simmering fundamental negatives that the rest of the world overlooks. If the masses are happy and arguing in unison that high returns can offset high inflation—and they don’t notice when the Fed implements contractionary policy—that could very well be cause for action. But if everyone sees and fears high inflation, then it could very well be priced in, setting the stage for those positive returns that follow higher inflation the majority of the time. So wait, watch and see.
If you would like to contact the editors responsible for this article, please message MarketMinder directly.
*The content contained in this article represents only the opinions and viewpoints of the Fisher Investments editorial staff.
Get a weekly roundup of our market insights
Sign up for our weekly e-mail newsletter.

You Imagine Your Future. We Help You Get There.
Are you ready to start your journey to a better financial future?

Where Might the Market Go Next?
Confidently tackle the market’s ups and downs with independent research and analysis that tells you where we think stocks are headed—and why.
Related Resources
-
Market Analysis The New Tariffs in Town Are Still Old News2026-07-24
-
Expert Commentary This Week in Review | Market Volatility, Tariffs, SpaceX
 2026-07-24
 -
Economics A Summertime Check-in on US Consumers2026-07-23
-
Expert Commentary Why Ken Fisher Is Optimistic About European Stocks
 2026-07-23


Learn More
Learn why 210,000 clients trust us to manage their money and how Fisher Investments and its affiliates may be able to help you achieve your financial goals.
As of 6/30/2026
New to Fisher? Call Us.
Contact Us Today