Personal Wealth Management / Market Volatility
The Danger in Trying to Time Volatility
Trading around volatility is generally far likelier to be costly than profitable.

When markets swing, we often warn readers of the cost of trying to time corrections—sharp, sentiment-driven stock market drops, usually of -10% to -20% or so. Human nature often drives investors to want to flee stocks at the exact moments market history shows they are far better off holding—or even buying. “Don’t time corrections” is an easy message to swallow when stocks are doing fine, but it is a very tough sell in real time. When stocks fall fast, getting on the sidelines can feel better. But it can also lead to missing big upside when stocks recover, setting you back from your long-term goals.
It is an unfortunate truth that market movement drives many investors’ decision-making. Fund flows are an imperfect measure, but they do suggest many folks buy after stocks rise and sell after they fall. That certainly appeared to be the case last year. The S&P 500 had two corrections—one in winter, one in autumn. The first was basically a double-bottom correction, reaching its low on February 9 and retesting it on March 23. As Exhibit 1 shows, equity fund outflows spiked both times. In March, they continued even after stocks began recovering. That same mentality showed up—on steroids—in December, as US stocks dealt with their second, much sharper correction. Stock fund flows turned negative in December’s second week, when the selloff started in earnest. They bottomed out the week ending December 28, a period including the Christmas Eve low and a big December 26 rally. And they continued the following week, even as stocks rebounded. People were responding to what just happened in the market, presuming it would continue and snowball. But by trying to steel themselves against what just happened, they took themselves out of the running to capitalize on what was to come.
Exhibit 1: US Equity Mutual Fund and ETF Flows 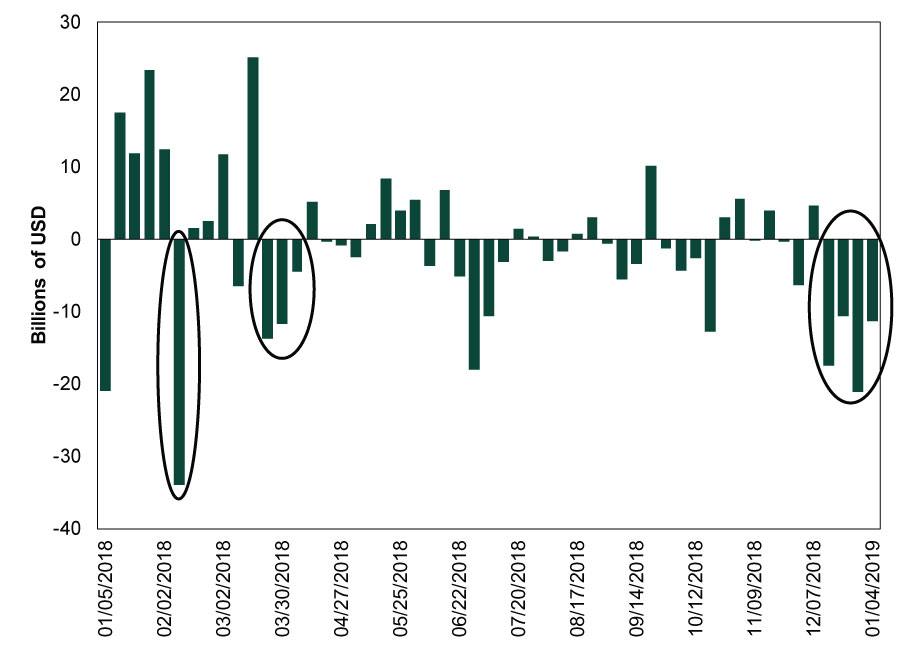
Source: FactSet, as of 1/11/2019. Investment Company Institute estimated weekly US long-term equity mutual fund and exchange-traded fund flows, 1/5/18 – 1/4/2019.
Selling after stocks have fallen can have big long-term consequences. To see this, consider Exhibit 2, which tracks two hypothetical investors during and after global stocks’ last big correction, which ran from May 21, 2015 through February 11, 2016. For simplicity, presume each invested $1 million in the MSCI World Index on January 2, 2015 and reinvested dividends. Investor A stayed invested through the entire correction and its aftermath, but investor B capitulated—selling on February 11, 2016. Shortly thereafter, they reversed course. Their portfolio was in cash for only a month. But in that month, world markets jumped 11.0%.[i] Even missing just that gain led to Investor B’s portfolio being worth over $105,000 less than Investor A’s by 2016’s close. Adding to Investor B’s woes, they finished 2016 down, while Investor A was up 6.6% since the beginning of 2015.[ii]
Exhibit 2: Sitting Out Is Potentially Costly 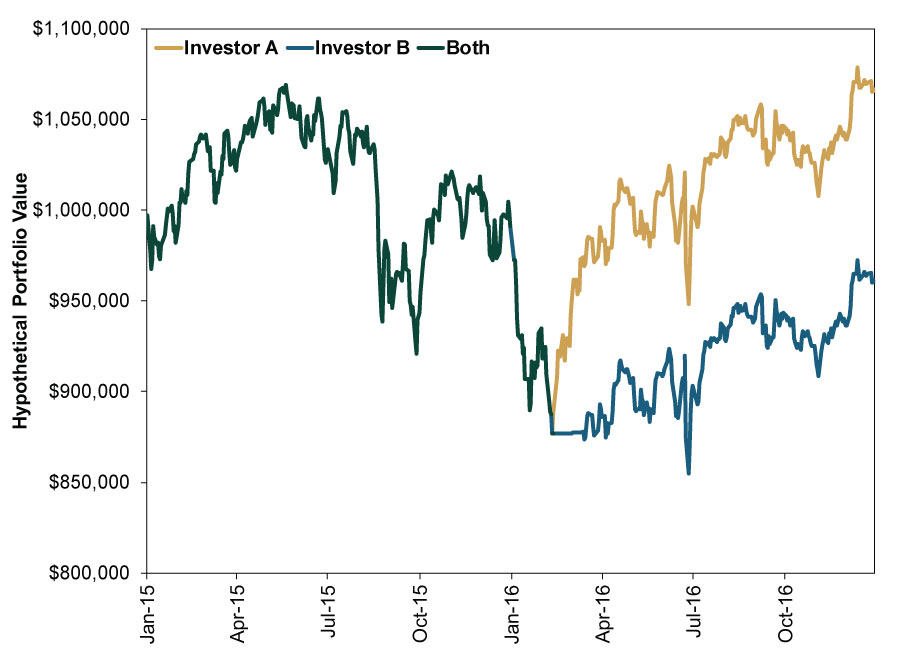
Source: FactSet, as of 1/10/2019. MSCI World Index return with net dividends and Bank of America US Treasury Bill (3-Month) Total Return Index, 12/31/2014 – 12/30/2016. 3-month T-bill is used to approximate cash returns. Indexed to $1,000,000 at 12/31/2014.
Exhibit 2 is an extreme example, but it illustrates a key point: Corrections end without warning, just as they begin without warning. Anyone who sold in February 2016 thought there was worse to come, based on how the volatility felt and what they saw in financial media. Investor A, who held on, had no way of knowing a rebound would start February 12. But by trusting in stocks’ long history of rebounding swiftly from sharp downturns, they were positioned to capture the recovery, whenever it occurred. They would have benefited whether the recovery started that day, the next week or the next month. It matters less when corrections end. What matters is that they do end, and when that happens, the ride up is usually about as fast as the ride down. As Fisher Investments founder and Executive Chairman, Ken Fisher, points out in USA Today, S&P 500 price returns in the 12 months following all corrections since 1925 average 34%.[iii]
You might look at Exhibit 2 and think, I would never sell at a low! Fair point. Yet even if you sell at a more optimal point earlier in the correction, it can be very difficult to make the move profitable, because timing the exit is only half the battle. Timing the re-entry is also crucial. If you get out early enough, you must still buy in at a lower point than where you sold. Yet this is easier said than done. Markets don’t sound an all-clear signal when corrections end. Rather, the optimal time to buy is usually when you least want to, when stocks have fallen fastest and headlines are darkest.
Consider Exhibit 3, whose hypothetical investor sold early in the correction, going to cash on 8/20/2015. Good timing! Only -5.9% down from the high![iv] But when would they have felt comfortable buying back in? In September 2015, when bond market liquidity fears were raging? In November, when the Paris attacks happened? What about the following January, when Chinese officials’ attempts to cushion their country’s stock market downturn looked so haphazard? Would you have wanted to buy in March, April or May, when everyone warned June’s Brexit vote could cause an earthquake? Would you have bought after Brexit won? Or at any point along this course, considering some slowing in economic data and rampant fear over junk bonds? Those are just some of the questions you would have faced in order to get back in by July 29, the date you’d need to buy in order for your defensive move to pay off. And that is just to break even, not profit, from the decision to get out.
Exhibit 3: Markets Can Bounce When You Least Expect 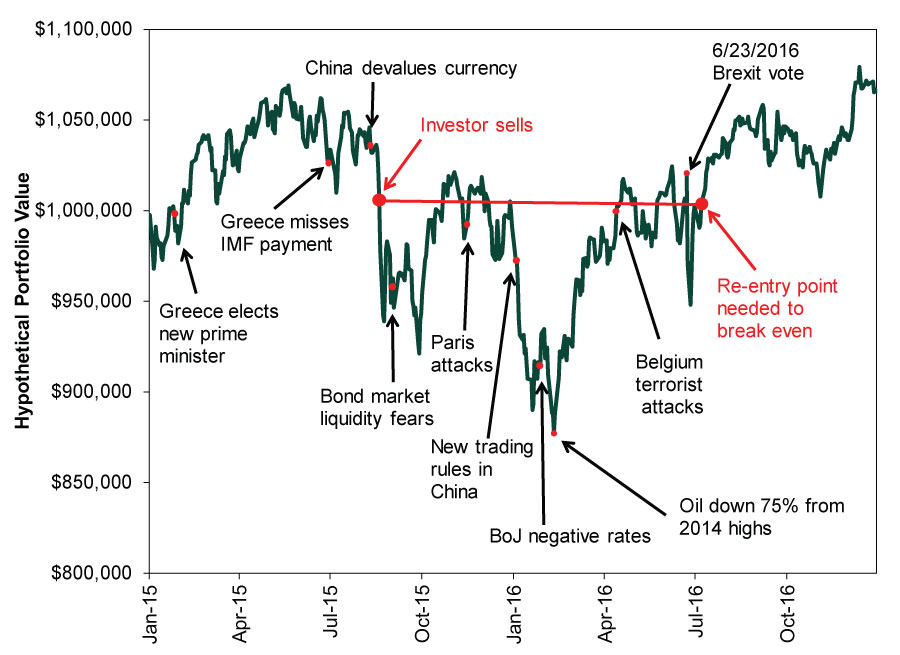
Source: FactSet, as of 1/10/2019. MSCI World Index return with net dividends, 12/31/2014 – 12/30/2016. Indexed to $1,000,000 at 12/31/2014.
Actually, you would probably need to buy even earlier than that when considering the added impact of taxes and trading costs. While we exclude them here for simplicity, they can further narrow the window for timing things profitably.
The good news is you don’t need to time markets to achieve stocks’ long-term growth. The S&P 500’s long-term average annualized return of 9.9% includes 13 bear markets and a few dozen corrections along the way.[v] For most investors, this means having the discipline to stick with their strategy during tough times is likely to increase the likelihood they reach their goals. Trying to sidestep short pullbacks, in our view, increases the risk of not reaching those goals, because it can lead to missed upside.
So if you managed to hang on through December’s wild ride, consider this a hearty high five. And if you didn’t, keep your chin up. While stocks are up 10.0% since the most recent low, we think we are still near the beginning of what should be a very nice recovery.[vi] Don’t wait for an all-clear signal that won’t come. Instead, refocus on your long-term goals, remember the asset allocation you likely need to maximize your chances of reaching them, and put it in place.
[i] Source: FactSet, as of 1/7/2019. MSCI World Index return with net dividends, 2/11/2016 – 3/11/2016.
[ii] Source: FactSet, as of 1/7/2019. MSCI World Index return with net dividends, 12/31/2014 – 12/31/2016.
[iii] Source: FactSet, as of 12/7/2018. S&P 500 price returns 12 months after correction troughs, 5/14/1928 – 2/11/2017.
[iv] Source: FactSet, as of 1/7/2019. MSCI World Index return with net dividends, 5/21/15 – 8/20/2016.
[v] Source: Global Financial Data, Inc., as of 1/9/2019. S&P 500 Total Return Index, 12/31/1925 – 12/31/2018.
[vi] Source: FactSet, as of 1/15/2019. S&P 500 total return, 12/24/2018 – 1/14/2019.
If you would like to contact the editors responsible for this article, please message MarketMinder directly.
*The content contained in this article represents only the opinions and viewpoints of the Fisher Investments editorial staff.
Get a weekly roundup of our market insights
Sign up for our weekly e-mail newsletter.

You Imagine Your Future. We Help You Get There.
Are you ready to start your journey to a better financial future?

Where Might the Market Go Next?
Confidently tackle the market’s ups and downs with independent research and analysis that tells you where we think stocks are headed—and why.
Related Resources
-
Expert Commentary This Week in Review | Global PMIs, SpaceX, RMD Planning
 2026-07-10
 -
Market Analysis Trim Your Angst on Economic Measurement Tweaks2026-07-09
-
Politics Long-Term Forecasts and Court Verdicts: The Latest in British and French Politics2026-07-09
-
Corporate Information How You Benefit from Fisher Investments' Transparent Fee Structure
 2026-07-08


Learn More
Learn why 210,000 clients trust us to manage their money and how Fisher Investments and its affiliates may be able to help you achieve your financial goals.
As of 6/30/2026
New to Fisher? Call Us.
Contact Us Today