Personal Wealth Management / Market Analysis
The Post-Lockdown Rally Turns One
Stocks aren’t acting like the last year was a new bull market.

One year ago today, global stocks hit bottom. They had fallen -34.0% since their high on the previous February 12, pricing in the strict lockdowns and resulting deep economic contractions across the US, Europe, Australia and the rest of the developed world.[i] The very next day, economic data would start registering that contraction courtesy of IHS Markit’s flash purchasing managers’ indexes (PMIs) for services and manufacturing. But stocks were already looking further ahead—they had priced the flood of bad news to come and were already looking forward to reopening and recovery. On paper, the steep rally over the past year is a new bull market. But as we will show, we think stocks are acting as if last year’s record-fast decline was the eighth correction in the bull market that began way back on March 9, 2009. That has two key forward-looking implications, as we will discuss.
A helpful way to see the past year’s uniqueness relative to other new bull markets, in our view, is to look at stylistic leadership. Usually, value stocks beat growth in a new bull market’s first stage. Value companies usually have shakier credit and rely on bank lending, making them extra-vulnerable in a bear market’s panicky final stage. Investors fear these companies won’t survive the recession and associated tighter credit conditions and punish them disproportionately. But they usually bounce just as fast in the new bull market, thanks to gutsy bargain-hunters seeking big returns in unfairly punished, economically sensitive firms and turnaround opportunities. This history, coupled with vaccine enthusiasm, is why the vast majority of pundits—and a record-high share of fund managers—expect value to beat growth for the foreseeable future.
But as Exhibits 1 – 3 show, the last year has looked much more like the typical aftermath of a correction that occurs late in a bull market than it does a new bull market. Exhibit 1 shows the past 12 months, with growth leading out of the gate and still ahead cumulatively, despite some countertrends. That looks nothing like Exhibit 2, which shows growth trailing over the first year following the prior two bear markets (again, with some countertrends). But it looks an awful lot like Exhibit 3, which shows the corrections occurring late in the 2002 – 2007 and 2009 – 2020 bull markets. In all three, growth led out of the gate and cumulatively over the full 12 months, with—yes—countertrends.
Exhibit 1: Growth Vs. Value Since Last Year’s Low
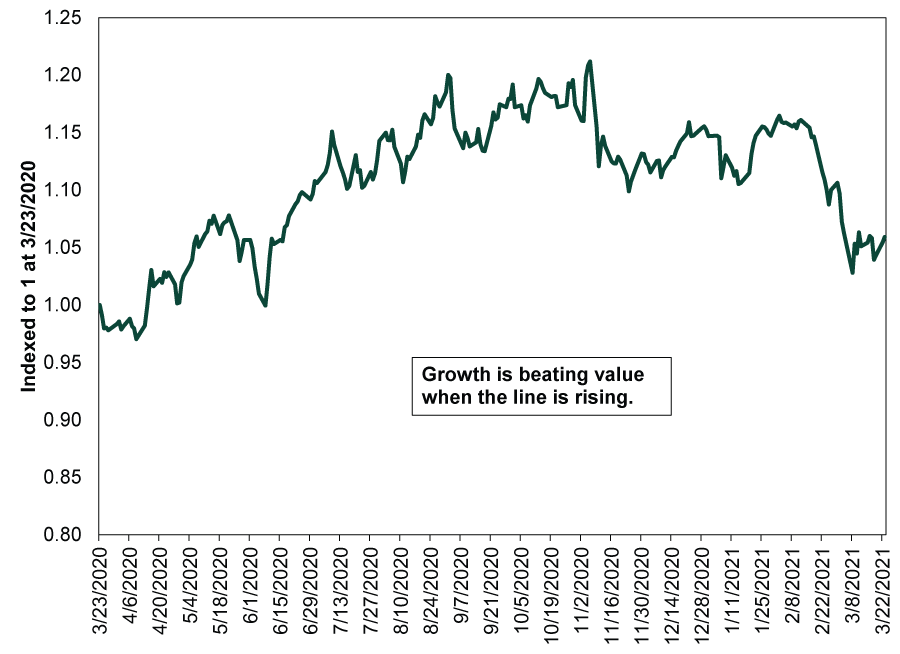
Source: FactSet, as of 3/23/2021. MSCI World Growth and Value Index returns with net dividends, 3/23/2020 – 3/23/2021. Indexed to 1 at 3/23/2020.
Exhibit 2: Growth Vs. Value in the First Year After Bear Market Lows
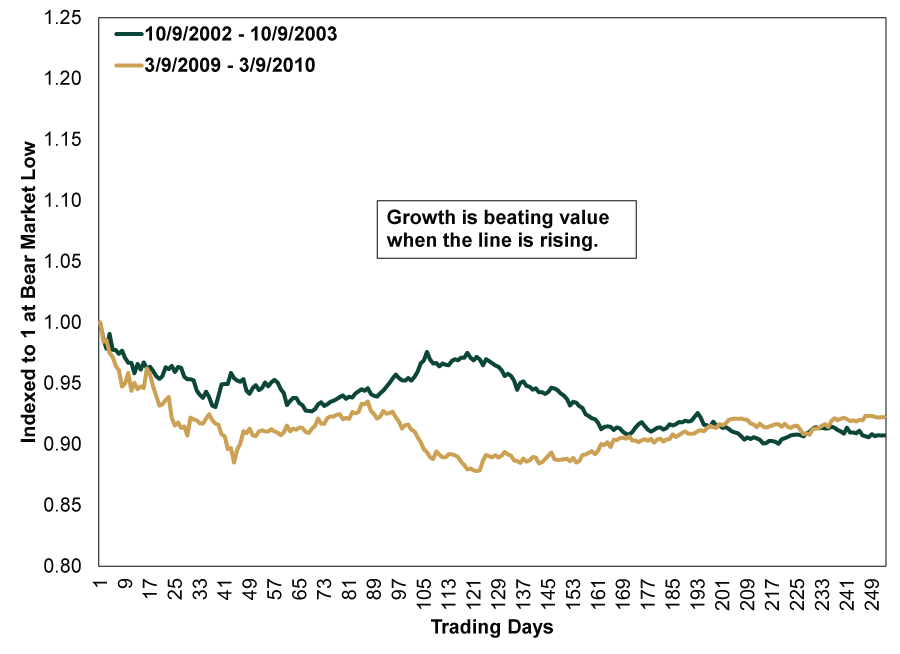
Source: FactSet, as of 3/23/2021. MSCI World Growth and Value Index returns with net dividends, 10/9/2002 – 10/9/2003 and 3/9/2009 – 3/9/2010. Indexed to 1 at the start of each period.
Exhibit 3: Growth Vs. Value in the First Year After Late-Bull Market Correction Lows
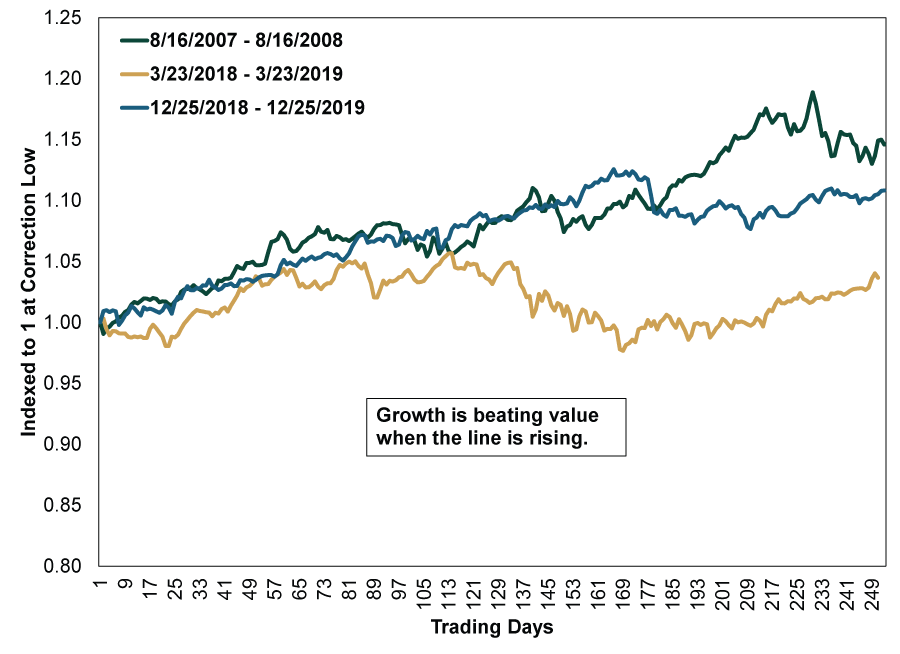
Source: FactSet, as of 3/23/2021. MSCI World Growth and Value Index returns with net dividends, 8/16/2007 – 8/16/2008, 3/23/2018 – 3/23/2019 and 12/25/2018 – 12/25/2019. Indexed to 1 at the start of each period.
Now, note that the 2007 – 2008 dataset in Exhibit 3 includes the first 10 months of the bear market that accompanied the global financial crisis, which we highlight a) in the interests of transparency and b) as a reminder that bear markets can arrive soon after corrections. But it still shows growth beating value right out of the gate, which underscores our point: That is what generally happens when stocks correct late in a bull market. (Growth’s continued leadership in the beginning of the ensuing bear market is a topic for another day.)
This full history is a big reason why we think the many, many people who expect value to take the baton and run with it now are likely in for some disappointment—that is our first takeaway. As the charts show, countertrends are normal—even big ones. They are fleeting functions of sentiment, and they are very good at fooling people. In our view, the key task for investors isn’t to time them perfectly, but to stay disciplined and focused on longer-term trends through them. Today, we think that means remembering markets are efficient and usually defy the most popular expectations. Forecasts for value leadership are too widespread—basic principles of markets’ efficiency dictate these forecasts are surely priced in. For more on that, see Monday’s look at industry trends.
The second main takeaway is a note of caution. Most pundits have seemingly penciled in years and years of bull market returns from here. That would be logical enough if stocks were acting like this was indeed a young bull market. But their behavior’s resembling a late-stage bull market implies the end of the run is probably much sooner than people think. We aren’t saying it is imminent. We are bullish! While sentiment has warmed considerably, it isn’t yet at the euphoric heights typical of peaks. Lingering worries over Europe’s vaccine distribution woes and potential US tax hikes are helping extend the wall of worry, keeping near-term expectations in check. But optimism eventually bubbles into euphoria, and it isn’t hard to imagine a few positive surprises along the road ahead inspiring that widespread cheer. Watching sentiment’s evolution—and how expectations square with the likely reality—will be critical as the months roll on.
Again, we think stocks still have room to rise. We think returns this year are likely to be very nice, with growth leading. But we think keeping a cool head, not letting greed get the best of you, and keeping your expectations in check will be key to navigating the rest of this bull market successfully.
[i] Source: FactSet, as of 3/23/2021. MSCI World Index return with net dividends, 2/12/2020 – 3/23/2020.
If you would like to contact the editors responsible for this article, please message MarketMinder directly.
*The content contained in this article represents only the opinions and viewpoints of the Fisher Investments editorial staff.
Get a weekly roundup of our market insights
Sign up for our weekly e-mail newsletter.

You Imagine Your Future. We Help You Get There.
Are you ready to start your journey to a better financial future?

Where Might the Market Go Next?
Confidently tackle the market’s ups and downs with independent research and analysis that tells you where we think stocks are headed—and why.
Related Resources
-
Market Analysis The New Tariffs in Town Are Still Old News2026-07-24
-
Expert Commentary This Week in Review | Market Volatility, Tariffs, SpaceX
 2026-07-24
 -
Economics A Summertime Check-in on US Consumers2026-07-23
-
Expert Commentary Why Ken Fisher Is Optimistic About European Stocks
 2026-07-23


Learn More
Learn why 210,000 clients trust us to manage their money and how Fisher Investments and its affiliates may be able to help you achieve your financial goals.
As of 6/30/2026
New to Fisher? Call Us.
Contact Us Today