Personal Wealth Management /
Timing the Taper
Many folks are bemoaning what the arrival of the taper means for markets, unaware that we already have a sneak preview of what the impact is like.

Nobody knows when the taper will happen... Not even this man. Alex Wong/Getty Images.
“At its most recent meeting, the Committee made clear that it is prepared to increase or reduce the pace of its asset purchases to ensure that the stance of monetary policy remains appropriate as the outlook for the labor market or inflation changes.”
Fed head Ben Bernanke uttered those words before the Congressional Joint Economic Committee on May 22, and as the story goes, sent some investors into a taper tizzy. Yet, as we approach the end of the year, the taper seems a little like a Federal budget—often discussed, rarely seen. That the taper isn’t yet a reality leaves many to speculate and wring hands over the potential outcome. But a sneak preview of tapering has been showing since Bernanke’s chatter—and the lessons stand in stark contrast to the common fears.
The Fed is currently purchasing $85 billion in long-term bonds each month as part of its quantitative easing (QE) program in its effort to reduce long-term interest rates, thereby stimulating borrowing and economic growth. Slowing these purchases—tapering—are the issue today. Many fear tapering would stunt or end growth. In our view, however, this is backwards—QE is contractionary. By lowering long-term rates, the gap between short- and long-term rates narrows. Banks’ loan profits are typically generated by the gap between short and long rates, so a narrow gap means each loan is less profitable—and less likely to happen. However, this notion isn’t commonly held, meaning most folks fret the taper. And even if they do accept it, some argue negative sentiment surrounding a taper could impact markets—for them, the sneak preview we’ve seen can be instructive.
Markets tend to move in advance of anticipated events—not after. And ever since Bernanke’s May 22 testimony, while many tried guessing when the taper will begin, the bond market was anticipating it. Exhibit 1 shows 10-Year Treasury yield movements in 2013 to date.
Exhibit 1: 10-Year Treasury Yield YTD
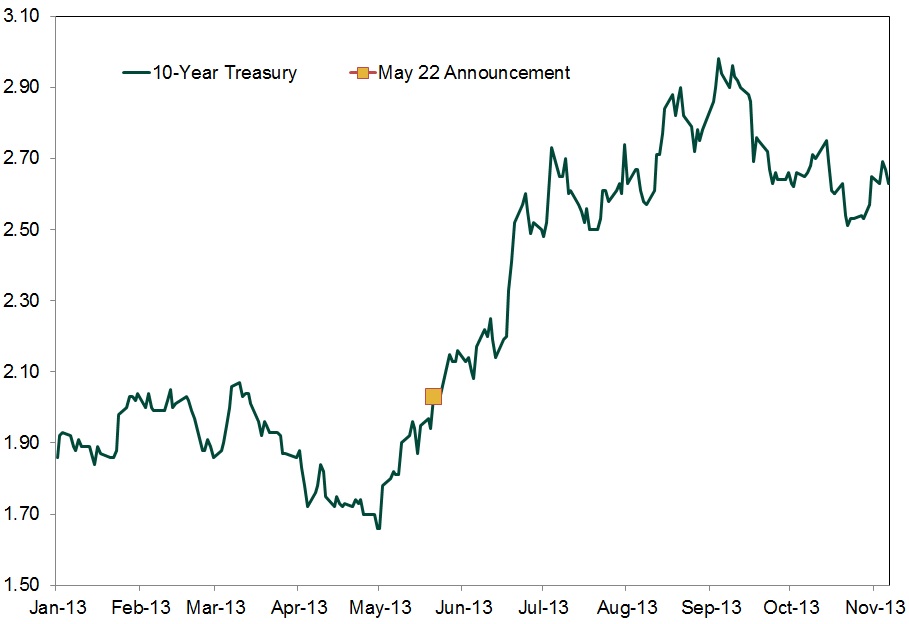
Source: St. Louis Federal Reserve, as of 11/12/2013.
On May 21, 10-Year Treasury rates closed at 1.94%. A month later, rates were 2.52%—an increase of more than half a percentage point. That’s large considering the low overall levels we’re discussing. And rates continued from there. By September, rates were more than 100 basis points higher.
Rates have backslid some since, but even now, they’re roughly 80 basis points above pre-May 22 levels. In the six months preceding May 22, rates averaged 1.85%. Since May 22, they’re averaging 2.57%. Now, we doubt bond markets fully reflect tapering’s impact today—it’s likely rates would drift a bit higher even beyond that point. But what you’re seeing is a sneak preview of tapering’s likely impact.
If bond markets are anticipating tapering, would stock markets act any differently? Unlikely. While some folks seem to get very caught up in stocks’ daily gyrations, the bigger picture tells a more interesting tale. Let’s say you focused ONLY on when Bernanke announced the possibility of a taper to now, ignoring all daily wiggles. (The markers in Exhibit 2.) You’d probably think tapering is quite bullish indeed! The S&P 500 returned a little over 8% from May 22 to November 12.
Exhibit 2: S&P 500 Total Return YTD
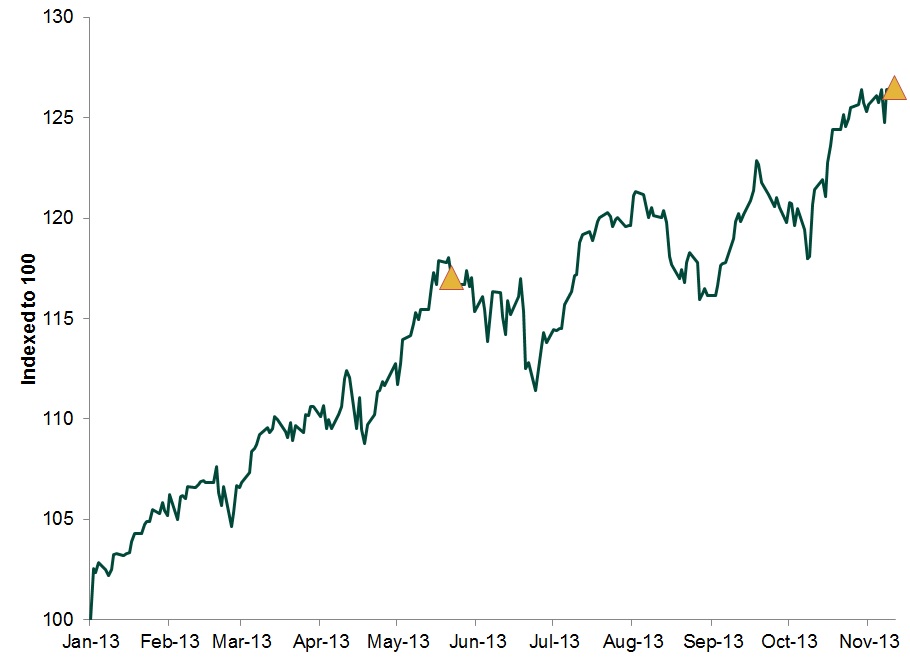
Source: FactSet, as of 11/12/2013.
You might say, “Well, that doesn’t mean tapering is bullish for stocks. There are other factors to weigh too.” To wit we say, you’re dead right—a factor to strongly consider if it is the taper you fear.
But what of those scary drops seemingly any time Bernanke sneezes, coughs or strokes his beard pensively? For example, in the two weeks that followed the May 22 announcement, the S&P 500 fell about 4%. After a June 19 Bernanke press conference, the S&P fell 5% in about a week—and was recouped in the following two weeks. And at the Fed head’s most recent press conference on September 18, the S&P rose initially when the taper was delayed (before retreating roughly 2% in about a week). Now, it is frequently fallacious to pin daily gyrations on any one, single event, but even if you can tie them directly to tapering, none of these drops amount to what we’d even consider correction ranges—they seem more like short-term, sentiment-driven volatility.
Ultimately, market reactions to taper talk are pretty much exactly what legendary investor Benjamin Graham referred to in perhaps his most famous quote: “In the short run, markets behave like voting machines, but in the long term they act like weighing machines.” Popular sentiment—the investing public’s vote—is tapering is to be feared, perhaps explaining the daily gyrations. The weight—the fundamental economic impact of tapering—is what stocks seemingly register over longer periods. And that is bullish.
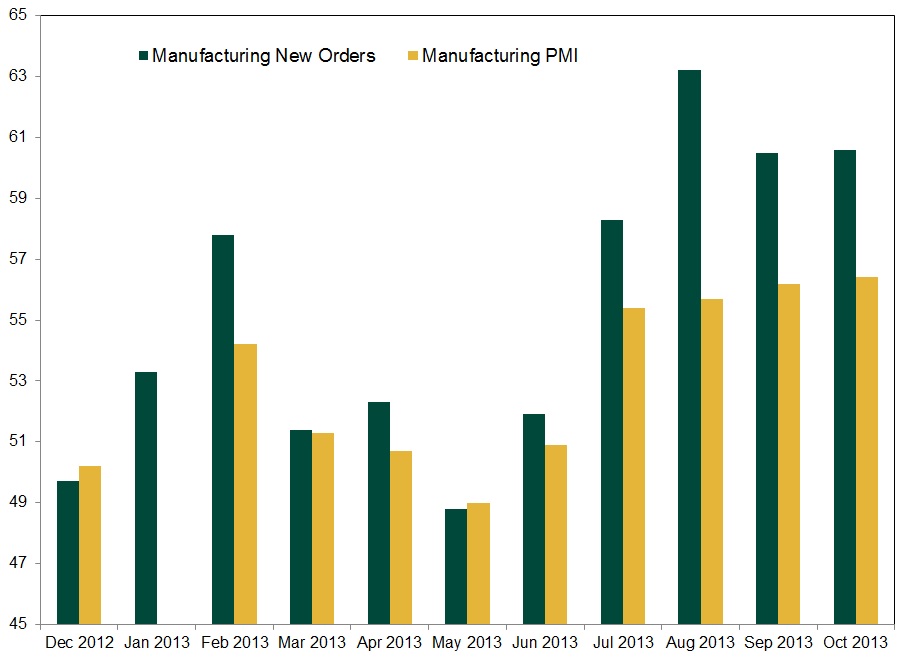
Economically, since taper talk began and the yield spread widened some, many economic indicators have accelerated. GDP, for one, has sequentially accelerated throughout 2013. Q1 was 1.1%. Q2 2.5%. and Q3 2.8%. The ISM Services index, expansionary throughout the year, has seen its forward-looking new orders subindex rise since May. (Exhibit 3) And the ISM manufacturing gauge has markedly improved—both the current output and new orders. (Exhibit 4)
Exhibit 3: ISM Services Index
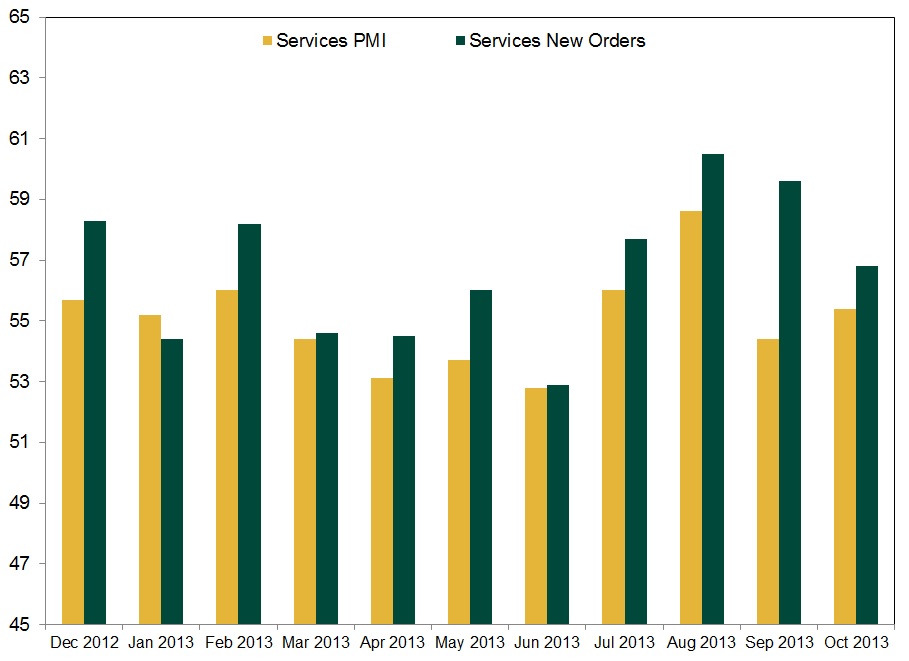
Source: FactSet Data Systems, Inc. As of 11/13/2013.
Exhibit 4: ISM Manufacturing Index
Source: FactSet Data Systems, Inc. As of 11/13/2013.
Mere coincidence? Possibly! But considering the yield spread is a long-standing leading economic indicator with a solid history of accurately predicting macroeconomic conditions, it seems to be more.
All this makes the media’s taper-timing obsession perplexing. In our view, it’s senseless to try and forecast the meeting at which QE ends. To us, it can’t come soon enough, whether that’s tomorrow or in March. Fearing QE tapering is getting it backwards, ignoring extant evidence from the UK and the US’s sneak preview. The fundamental positives associated with ending this mistaken policy far outweigh daily sentiment swings.
If you would like to contact the editors responsible for this article, please message MarketMinder directly.
*The content contained in this article represents only the opinions and viewpoints of the Fisher Investments editorial staff.
Get a weekly roundup of our market insights
Sign up for our weekly e-mail newsletter.

You Imagine Your Future. We Help You Get There.
Are you ready to start your journey to a better financial future?

Where Might the Market Go Next?
Confidently tackle the market’s ups and downs with independent research and analysis that tells you where we think stocks are headed—and why.
Related Resources
-
Economics Quick Hit: Durably Broad-Based Growth2026-07-29
-
Market Analysis On the Chop in the Oil Market2026-07-29
-
Politics Takaichi Raises Japan’s Wall of Worry2026-07-27
-
In The News Why Kevin Warsh should think twice about hiking interest rates — even as anxiety over the Iran war grows2026-07-27


Learn More
Learn why 210,000 clients trust us to manage their money and how Fisher Investments and its affiliates may be able to help you achieve your financial goals.
As of 6/30/2026
New to Fisher? Call Us.
Contact Us Today