Personal Wealth Management / Politics
Today in Brexit, Day 1,316
As Brexit becomes official, we take a look back and a look ahead.

Today in Brexit, Brexit happened—a development more than three and a half years in the making. Big Ben did not bong for the occasion, but at 11 PM GMT (3 PM PST), the UK officially left the EU. It happened 10 months behind schedule, and an American who graduated high school the month of the referendum would now be entering their final semester as a college undergrad. The nearly four-year haggling process included three UK prime ministers, two general elections and approximately 2.8 million op-eds arguing for or against going through with Brexit.[i] Now the saga is over, and thus begins … another round of negotiations to finalize a trade deal before the Brexit transition phase expires at yearend. Business confidence is surging, and purchasing managers’ indexes suggest the UK economy is already benefiting from falling uncertainty. But the BoE and its outgoing chief, Mark Carney, are less cheerful. They aren’t projecting recession, but they did slash GDP forecasts yesterday, citing the aggressive departure timeline. So we thought it would be fun to look back at what they and Her Majesty’s Treasury forecasted about Brexit four years ago—not to poke fun, but to show why investors should take the latest pessimism with a grain of salt.
Leading up to the referendum, Carney warned often that a vote to leave the EU could lead to recession. So did then-Chancellor of the Exchequer George Osborne. Under his stewardship, the Treasury released an official analysis of the referendum’s potential economic impact in May 2016, mere weeks before the June 23 vote. It was a 90-page tour de force in hyperbolic language, scary charts and scary numbers. It didn’t just think eventually leaving the EU would bring recession—it warned the vote itself would do the trick: “The first effect of a vote to leave the EU would be that businesses and households would start to make decisions consistent with the transition to becoming permanently poorer in the long term.” Incorporated in its models was the assumption that the country would “transition to a less open, less productive and permanently poorer economy.”
While we have never been for or against Brexit, we always thought that logic was a bit of a leap. Saying Brexit would make the UK “less open” struck us as a political opinion, not a statement of fact. Leaving the EU might add some friction to trade between the UK and the other 27 member-states, but it also enables the UK to build stronger trade ties to the rest of the world. As an EU member, the UK couldn’t sign its own free-trade agreements. It could only be part of EU agreements, which tend to incorporate member-states’ protectionist pet peeves and aren’t really “free” trade agreements as a result. Outside the EU, the UK can sign bespoke free-trade agreements with the US and major Asian economies, vastly expanding its global reach. Freeing trade with the rest of the world was one of the Leave campaign’s key arguments. This was one of many reasons we didn’t share the Treasury’s pessimism.
Now we have actual data with which to grade those pre-Brexit forecasts, so we decided to have some fun. The Treasury ran two hypothetical scenarios: a “shock” and a “severe shock.” The control group was the Office for Budget Responsibility’s (OBR) March 2016 economic projections, which presumed the UK would vote to Remain. They presented the shock and severe shock forecasts in terms of their difference from that control group—as in, GDP would be X% lower than it would have been if the UK stayed in the UK, the number of unemployed persons would be Y higher, the inflation rate would be Z percentage points higher, yada yada yada.
The easiest part of this report card to compute was GDP, since the Treasury’s report included quarterly projections for all three scenarios—shock, severe shock, and remain. Both Leave scenarios presumed GDP would shrink for a year and crawl thereafter. Yet as Exhibit 1 shows, that didn’t happen. Reality came close to the OBR’s no-Brexit forecasts, and UK GDP has now grown a hair above 5% since the referendum.
Exhibit 1: What Recession?
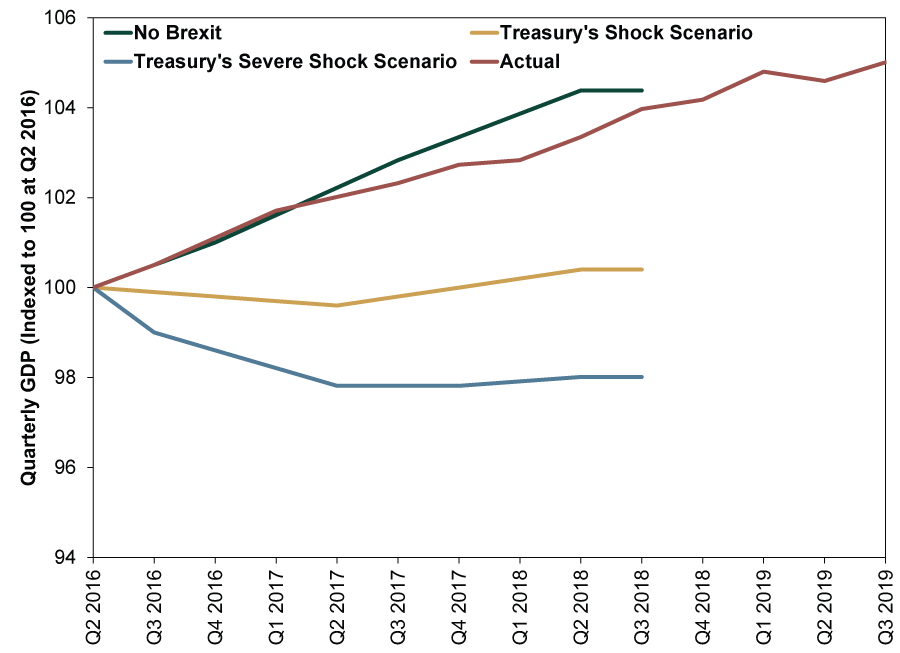
Source: FactSet and HM Treasury, as of 1/31/2020. HM Treasury forecasts for quarter-over-quarter real GDP growth, Q3 2016 – Q2 2018, and actual quarter-over-quarter real GDP growth, Q3 2016 – Q3 2019.
Other variables were a bit harder to grade, as the OBR’s forecast didn’t include quarterly forecasts for inflation, home prices or unemployment—just annual. The Treasury’s gloomy report didn’t include a quarterly breakdown, either. Instead, it just said inflation would be 2.3 percentage points higher than the no-Brexit path after two years under the shock scenario and 2.7 percentage points higher under the severe shock scenario. Compared to the no-Brexit scenario, unemployment would rise 1.6 percentage points in a shock and 2.7 percentage points in the severe shock. The unemployment level would be 520,000 persons higher in a shock and 820,000 persons higher in a severe shock. Lastly, home prices would be 10% below no-Brexit prices in a shock and 18% below in a severe shock.
So we dug up the OBR’s forecast, looked at its projections, and squared them with reality and the Treasury’s Brexit scenarios. Inflation was easy—just add a few percentage points to the OBR’s 2018 forecast. Unemployment was trickier, and the OBR’s report projected only the unemployment rate, not the level. After scrutinizing the Treasury’s forecasts, we determined they imputed the unemployment level from the unemployment rate, so we did the same, using recent data to estimate the unemployment level that matched their projected unemployment rate, then we added the Treasury’s projected increases. For home prices, we applied the OBR’s projected growth rates to 2016 home prices, then applied the Treasury’s Brexit discounts. Sorry to go all math nerd on you, but we thought it was important to show where the numbers in Exhibit 2 came from. Especially since they show reality didn’t just beat the Brexit forecasts—in some categories, it beat the baseline forecast.
Exhibit 2: So Much for the Brexit Shock
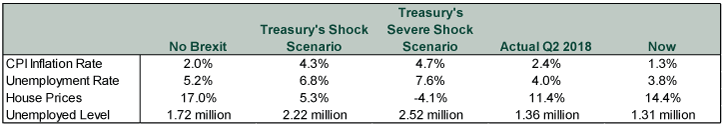
Source: FactSet, HM Treasury and Office for Budget Responsibility, as of 1/30/2020. Projections are imputed from year-end 2015 levels and the OBR and Treasury forecasts. Actual data in the final two columns reflect the year-over-year CPI inflation rate; 12/31/2015 – 12/31/2019, unemployment and unemployed level; 12/31/2015 – 10/31/2019; and house price index, 12/31/2015 – 11/30/2019.
Now, that doesn’t mean the BoE is wrong that growth will slow now. Perhaps they prove correct. While uncertainty has fallen considerably thanks to Brexit being done, it hasn’t evaporated. Some businesses might delay investments a while longer to see what the UK and EU’s long-term trade relationship will be. It wouldn’t surprise us if negotiations dragged on and we got another round of no-deal Brexit fears as year-end approached. But that also seems like the wrong way to view this situation. If the UK and EU don’t reach a trade deal, tariffs will revert to WTO terms. Both sides have Most Favored Nation status, which means low tariffs. The biggest question mark is regulations. Will the EU require harmonization, or will they deem the UK’s standards sufficient? Even if they don’t reach an agreement that looks favorable in the near term, that doesn’t mean trade stops.UK regulations presently match the EU’s. Any de- (or re-) regulating would take time. Think of it as a very gradual slope, not a cliff edge. Plus, considering the high volume of EU goods that go to the UK, EU leaders have a rather large incentive to compromise. Meanwhile, the UK’s economy is services-heavy, and the EU doesn’t exactly have free trade in services. Barriers were already high.
Forecasts are opinions. They reflect and shape prevailing sentiment. So rather than being bearish, slower forecasts help shift sentiment lower, giving reality a lower bar to clear. It won’t take much for the UK to beat the BoE’s dismal 2020 GDP forecast (0.8% annual growth), lending stocks a tailwind. Plus, the economy is only one market driver. Falling uncertainty is another powerful tailwind, and the UK is enjoying that right now. It should fall further as businesses gain clarity on trade and people see being out of the EU isn’t the end, but rather the start of a new era—one in which the UK pursues free-trade with America and others as well as its European neighbors.
If you would like to contact the editors responsible for this article, please message MarketMinder directly.
*The content contained in this article represents only the opinions and viewpoints of the Fisher Investments editorial staff.
Get a weekly roundup of our market insights
Sign up for our weekly e-mail newsletter.

You Imagine Your Future. We Help You Get There.
Are you ready to start your journey to a better financial future?

Where Might the Market Go Next?
Confidently tackle the market’s ups and downs with independent research and analysis that tells you where we think stocks are headed—and why.
Related Resources
-
Expert Commentary Why Ken Fisher Is Optimistic About European Stocks
 2026-07-23
 -
Economics A Summertime Check-in on US Consumers2026-07-23
-
Market Analysis Why the SOX “Bear Market” Isn’t Foreboding2026-07-21
-
Politics Blunting Burnham?2026-07-21


Learn More
Learn why 210,000 clients trust us to manage their money and how Fisher Investments and its affiliates may be able to help you achieve your financial goals.
As of 6/30/2026
New to Fisher? Call Us.
Contact Us Today