Personal Wealth Management / Economics
Trading in Myths
Wednesday’s US international trade report provides data contradicting a few widely held myths.

Wednesday, the US Census Bureau published May 2012’s international trade report—which was promptly met with a host of cheers that the trade deficit shrank and jeers that exports grew only about 0.7% m/m. Leaving all that aside, the report provides a wealth of data to test a couple of widely held fears: that trade with China is rigged unfairly and the US is feeling dire effects of the eurozone’s debt crisis.
First, the monthly details. May imports fell -0.7% m/m (+3.8% y/y) to $231.8 billion, though this seems to be largely attributable to imported oil. Likely through the combination of lower barrel prices and potentially increased domestic production, crude oil imports alone were $2.8 billion lower than April’s level, outweighing imports’ total monthly decline of -$1.6 billion. (Therefore, we’d be wary of speculation imports’ monthly dip signifies weak US demand.) Exports rose +0.2% m/m (+4.2% y/y) to $183.1 billion. Total trade, therefore, amounted to $414.9 billion—a hair below March’s all-time high (see Exhibit 1).
Exhibit 1: US Total Trade (Exports + Imports, Millions of USD)
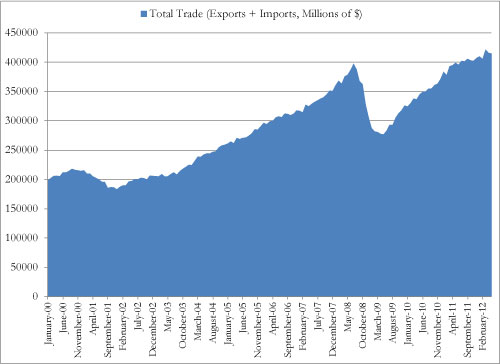
Source: US Census Bureau, January 1, 2000 – May 31, 2012.
But as is fairly commonplace with trade data, figures weren’t the only thing released Wednesday. Hot air over the US’s trade deficit with China abounded as well. We’ve addressed the myth that trade deficits in general and with specific countries are bad many times in this space. The simple fact is imports—cheap or expensive—simply add to consumer choice and competition. But the reality is, too, a focus on exports minus imports can miss some pretty important developments over time.
The US trade deficit with China obscures the view presented in Exhibit 2, which indexes both exports and imports to 100 in January 2000. Note which line is above the other—implying US export growth to China in this century to date has been far quicker than import growth from China.
Exhibit 2: US Exports To and Imports From China (Indexed to 100 at January 2000)
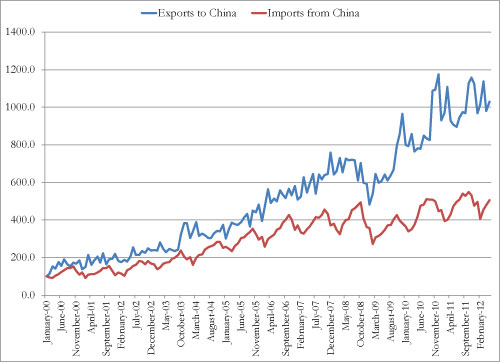
Source: US Census Bureau.
Another often repeated refrain, particularly lately, has been that the eurozone’s weakness is beginning to exert itself on the US. If this were true, one would expect to see it in trade data—namely, US exports to the 17 eurozone nations.
Through the first five months of 2012, US exports to the eurozone total $82.6 billion. Through the same period last year, US exports to the eurozone totaled $80.9 billion. The resulting growth rate of around 2% certainly isn’t gangbusters, and by no means are we arguing all’s hunky-dory in euroland—but it’s also not exactly the huge global drag many presume. This can also be seen in a simple year-over-year comparison of May’s monthly data (Exhibit 3).
Exhibit 3: US Exports to the Eurozone (January 2011 – May 2012, Billions of USD)
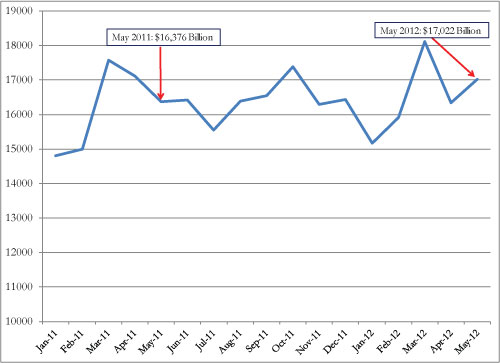
Source: US Census Bureau.
The reality is there are a bevy of myths about trade, but looking to the data can offer a very different perspective.
If you would like to contact the editors responsible for this article, please message MarketMinder directly.
*The content contained in this article represents only the opinions and viewpoints of the Fisher Investments editorial staff.
Get a weekly roundup of our market insights
Sign up for our weekly e-mail newsletter.

You Imagine Your Future. We Help You Get There.
Are you ready to start your journey to a better financial future?

Where Might the Market Go Next?
Confidently tackle the market’s ups and downs with independent research and analysis that tells you where we think stocks are headed—and why.
Related Resources
-
Market Analysis The New Tariffs in Town Are Still Old News2026-07-24
-
Expert Commentary This Week in Review | Market Volatility, Tariffs, SpaceX
 2026-07-24
 -
Economics A Summertime Check-in on US Consumers2026-07-23
-
Expert Commentary Why Ken Fisher Is Optimistic About European Stocks
 2026-07-23


Learn More
Learn why 210,000 clients trust us to manage their money and how Fisher Investments and its affiliates may be able to help you achieve your financial goals.
As of 6/30/2026
New to Fisher? Call Us.
Contact Us Today