Personal Wealth Management / Market Analysis
What a Big 2019 Says About 2020
One year’s big returns don’t dictate what comes next.

With 12 days left in 2019, stocks are on track for a solid year. Through Wednesday’s close, the MSCI World Index is up 26.2%, and the S&P 500 is closing in on 30%.[i] This has inspired a few “huzzahs” among the general punditry, but we also see lots of people arguing stocks are probably out of gas after a huge year and won’t do much in 2020. We think there are a couple errors at work here. One, viewing 2019 in a vacuum. Two, presuming one year’s returns influence the next.
Yes, 2019 has been great. But it is also part of a larger story that begins in January 2018, when global stocks entered a correction. Then, after a slow summer grind higher, they entered another one—which got really bad in December, which we believe was driven by a raft of hedge funds deciding it made more financial sense to liquidate, close shop and start anew than continue. Many funds, in our view, were in a race to liquidate in the weeks leading up to Christmas, putting the decline mere millimeters away from bear market territory. That correction reached its lowpoint on Christmas Day (when only Japanese and Israeli markets were open). Hence, 2019’s start lined up almost perfectly with the typical post-correction V-shaped bounce that followed. That bounce is responsible for a good chunk of 2019’s return. Said differently, a lot of that 26.2% rise went toward erasing a nasty late-2018.
Exhibit 1: 2019 in Context
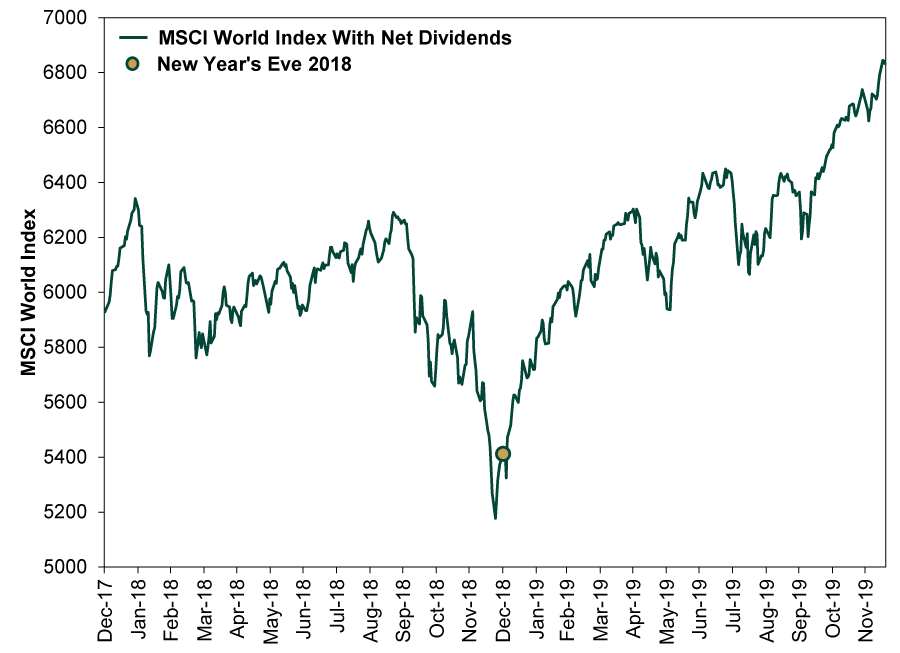
Source: FactSet, as of 12/19/2019. MSCI World Index with net dividends, 12/31/2017 – 12/18/2019.
Then again, even if a correction recovery wasn’t part of the story, a strong 2019 wouldn’t automatically set up a blah 2020. To say it does is to argue stocks revert to the mean. News flash: They don’t. Stocks move on supply and demand, not statistical forces.
Since the MSCI World Index’s inception on 12/31/1969, it has enjoyed 16 years of 20% or higher returns. Returns in the following year ranged from -13.25% to 41.9%. Positive returns happened 12 times—7 of which were double digits. Yes, the next year’s return was higher only twice, but a positive year after a positive year is … a positive year.
Exhibit 2: Global Stocks Often Keep Going After Great Years
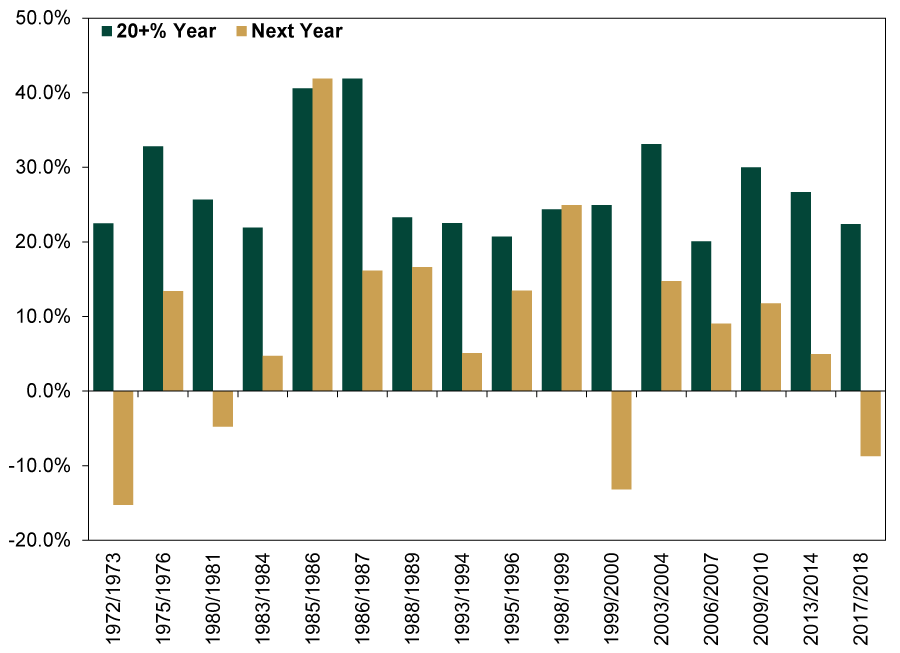
Source: FactSet, as of 12/18/2019. MSCI World Index annual returns with net dividends for the years shown.
Stretching back even further, the S&P 500 topped 20% in a year 34 times since 1925. The next year was negative 11 times. But there were seven back-to-back years exceeding 20%. In the mid-1990s, there were five in a row.
Exhibit 3: So Do US Stocks
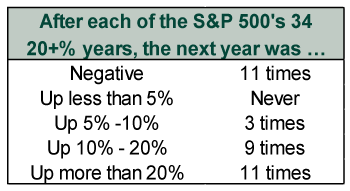
Source: Global Financial Data, Inc., as of 12/18/2019. S&P 500 annual total returns, 1926 – 2018.
None of this is to say a good year begets positivity in the following. It is mostly a function, in our view, of the fact US stocks have risen in nearly three-fourths of all calendar years since 1925.[ii] (Ditto for global stocks over their shorter history.[iii]) Plus, with bull market returns often coming in clumps, it isn’t shocking that big years would cluster together now and then.
This doesn’t mean next year’s returns will be whopping. But it also doesn’t mean they won’t be. What happens next year will depend on how political and economic factors play out—and how that reality squares with expectations. For now, expectations seem tame, making positive surprise likelier than not. Bear markets start either when euphoric sentiment makes irrationally happy investors ignore creeping negatives—or when some huge, unseen negative wallops a few trillion dollars off global GDP, causing a global recession. We don’t see either today, which makes us think owning stocks remains wise for investors who need long-term growth—regardless of what happened in 2019.
[i] Source: FactSet, as of 12/19/2019. MSCI World Index return with net dividends and S&P 500 total return, 12/31/2018 – 12/18/2019.
[ii] Source: Global Financial Data, Inc., as of 12/18/2019. S&P 500 frequency of positive annual total returns, 1926 – 2018.
[iii] Source: FactSet, as of 12/19/2019. MSCI World Index frequency of positive annual returns with net dividends, 1970 – 2018.
If you would like to contact the editors responsible for this article, please message MarketMinder directly.
*The content contained in this article represents only the opinions and viewpoints of the Fisher Investments editorial staff.
Get a weekly roundup of our market insights
Sign up for our weekly e-mail newsletter.

You Imagine Your Future. We Help You Get There.
Are you ready to start your journey to a better financial future?

Where Might the Market Go Next?
Confidently tackle the market’s ups and downs with independent research and analysis that tells you where we think stocks are headed—and why.
Related Resources
-
Market Analysis The New Tariffs in Town Are Still Old News2026-07-24
-
Expert Commentary This Week in Review | Market Volatility, Tariffs, SpaceX
 2026-07-24
 -
Economics A Summertime Check-in on US Consumers2026-07-23
-
Expert Commentary Why Ken Fisher Is Optimistic About European Stocks
 2026-07-23


Learn More
Learn why 210,000 clients trust us to manage their money and how Fisher Investments and its affiliates may be able to help you achieve your financial goals.
As of 6/30/2026
New to Fisher? Call Us.
Contact Us Today