Personal Wealth Management / Economics
What August’s Jobs Numbers Say About Depression Comparisons
As more temporarily unemployed people return to work, the latest jobs data look like a typical recession aftermath.

The BLS released August’s job report last Friday, which showed ongoing improvement. As usual in an early economic recovery, headlines fretted slower hiring and the long road ahead to regaining pre-pandemic employment. Fair enough, and for those suffering joblessness, slower hiring isn’t good news. Yet it also isn’t out of step with a typical recovery. In a way, that is the most interesting thing about August’s report—how much less extraordinary the numbers are starting to look. That guts the popular theory in April and May, which held that Depression-level unemployment would hinder the recovery and stocks. Consider this the latest evidence that employment numbers are late-lagging indicators.
At unemployment’s April apex, 23 million people were out of work, the unemployment rate hit 14.7% and the U6 rate that includes discouraged workers was 22.8%.[i] Many feared worse to come and drew comparisons with the early 1930s. The implication: that with tens of millions jobless, this wasn’t just a temporary economic contraction tied to forced business closures, but something much longer-lasting—an L-shaped recovery for the economy and, by extension, stocks. We never bought that, as unemployment is a late-lagging indicator and, in this case, the downturn’s most unique feature was that most layoffs were temporary, with workers set to return as counties lifted COVID-related restrictions. A deeper look at August’s nonfarm payroll report confirms that. Nonfarm payrolls rose by 1.37 million.[ii] Excluding big government hiring (mostly for the census), the private sector added just over a million jobs. That brings the cumulative total of new non-government hires to 10.5 million since April, cutting job losses since February in half.[iii]
Notably, all of this improvement comes from the temporary unemployment category. At April’s peak, 18 million workers were on temporary layoff and 2 million reported their job loss as permanent.[iv] Now roughly 6.2 million report being temporarily unemployed.[v] It seems fair to assume at least some of those temporary losses became permanent, considering the tally of people reporting permanent job loss rose to 3.4 million.[vi] Businesses small and large unfortunately had to dismiss workers as they cut back in hopes of surviving longer-than-expected restrictions on commercial activity—or folded altogether.
Relative to history, however, 3.4 million permanently unemployed people isn’t abnormally high just after a recession. After the 2007 – 2009 recession ended, the unemployment rate peaked at 10.0% in October.[vii] Then, there were 1.7 million people on temporary layoff, but 6.8 million permanent job losses.[viii] Or, consider 2001’s recession. Unemployment peaked two years later in June 2003 at 6.3%, with 1.2 million temporary job losses and 2.9 million permanent.[ix] This illustrates just how unusual this year’s early surge in temporary joblessness was. Today’s temporary unemployment numbers are still uniquely high, but many COVID restrictions have remained in place through the summer. For example, hair salons and other personal services are only just beginning to reopen in most of California, America’s most populous state. As more businesses reopen, temporary unemployment numbers should continue improving.
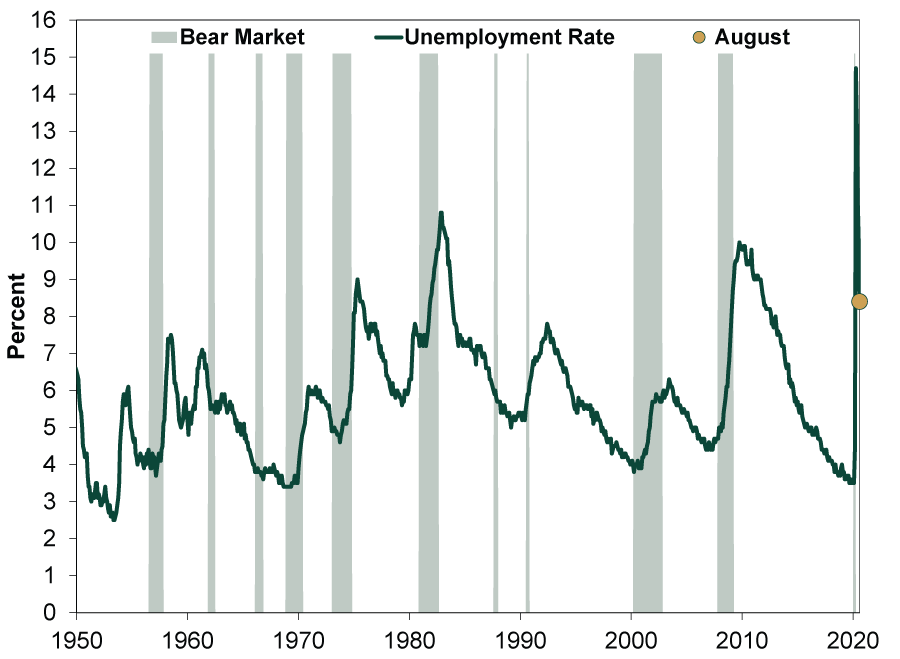
Other figures in August’s report also look much more like your typical post-recession environment than their springtime comparisons. The unemployment rate fell to 8.4% from 10.2% in July.[x] (Exhibit 1) This is below unemployment peaks in 1975, 1982 and the aforementioned 2009. It is still high relative to your typical economic expansion, but not out of sync with past recoveries and a far cry from the widely feared Depression levels many cited in the spring.
Exhibit 1: High Unemployment Hasn’t Prevented Bull Markets Historically
Source: Federal Reserve Bank of St. Louis, as of 9/4/2020. U-3 unemployment rate, January 1950 – August 2020.
Crucially, the unemployment rate fell even as more people entered the workforce. The unemployment rate isn’t the percentage of the entire population that doesn’t have a job. Rather, it is unemployed job seekers as a percentage of the total labor force (those working or actively seeking work). As a result, even if more people lose their jobs, the unemployment rate could still fall if enough people simultaneously get discouraged and stop looking for work. August’s data show the opposite: The labor force increased by 968,000 and labor force participation rate climbed 0.3 percentage point to 61.7% of the workforce.[xi] This is still below February’s pre-lockdown 63.4%, but unemployment falling as labor force participation rates rise is a good sign of real healing in the labor market.
No recovery is instant. For people who are out of work for months and facing personal hardship, a gradual labor market improvement is cold comfort, and we don’t dismiss the impact on those affected. But stocks are forward-looking, and jobs numbers reflect the past, not the future. Economic growth creates jobs, not the other way around, and there is lots of evidence economic recovery is underway. Further permanent job losses may come as more businesses assess their post-recession finances and make the difficult decision to get leaner, but this, too, is normal in the first few months of an economic recovery. Most importantly, we think stocks are signaling a much brighter future over the next year, two or three, when the virus is old news, society has adapted, and the economy has re-established some kind of normal.
[i] Source: Federal Reserve Bank of St. Louis, as of 9/9/2020. Unemployment level, unemployment rate and U-6 rate, April 2020.
[ii] Source: Bureau of Labor Statistics, as of 9/4/2020. Nonfarm payrolls, August 2020.
[iii] Ibid. Private nonfarm payrolls, March 2020 – August 2020.
[iv] Source: Federal Reserve Bank of St. Louis, as of 9/8/2020. Permanent job losers and job losers on temporary layoff, April 2020.
[v] Ibid. Job losers on temporary layoff, August 2020.
[vi] Ibid. Permanent job losers, August 2020.
[vii] Ibid. Unemployment rate, October 2009.
[viii] Ibid. Permanent job losers and job losers on temporary layoff, October 2009.
[ix] Ibid. Unemployment rate, permanent job losers and job losers on temporary layoff, June 2003.
[x] Source: Bureau of Labor Statistics, as of 9/4/2020. Unemployment rate, August 2020.
[xi] Ibid. Labor force and labor force participation rate, August 2020.
If you would like to contact the editors responsible for this article, please message MarketMinder directly.
*The content contained in this article represents only the opinions and viewpoints of the Fisher Investments editorial staff.
Get a weekly roundup of our market insights
Sign up for our weekly e-mail newsletter.

You Imagine Your Future. We Help You Get There.
Are you ready to start your journey to a better financial future?

Where Might the Market Go Next?
Confidently tackle the market’s ups and downs with independent research and analysis that tells you where we think stocks are headed—and why.
Related Resources
-
Expert Commentary 3 Things You Need to Know This Week | Midterm Miracle, US Jobs, Tax Planning
 2026-07-07
 -
Weekly Wrap-Up Fisher Investments Reviews: Last Week in Markets—June 29 - July 32026-07-07
-
Market Analysis Can Germany Engineer Faster Growth at Last?2026-07-07
-
Expert Commentary This Week in Review | Q2 Market Recap, June US Jobs, Trade Deal Update
 2026-07-03


Learn More
Learn why 210,000 clients trust us to manage their money and how Fisher Investments and its affiliates may be able to help you achieve your financial goals.
As of 6/30/2026
New to Fisher? Call Us.
Contact Us Today