Personal Wealth Management / Market Analysis
What to Glean From the UK’s May Monthly GDP Release
Stripping away COVID skew, plenty of strong areas remain.

A curious thing happened on the way to the UK’s allegedly surefire recession Wednesday: Some of the data that supposedly confirmed its existence were revised away. Not only did monthly GDP grow in May, but April’s contraction was milder than initially reported, and March’s slide flipped to a slight gain. Now, parsing the numbers here won’t give you much insight into whether a recession is or isn’t underway—the jury remains out, as it always does when pockets of weakness and relative strength abound. But the revised wobbles show why getting bogged down in headline data isn’t too productive. Stocks look forward, not at backward-looking numbers that won’t be final until long after the fact.
Exhibit 1 shows how this year’s results evolved between April and May. Overall, the changes aren’t terribly significant, but they shifted GDP growth expectations pretty radically. Entering this week, most everyone had penciled in a Q2 decline. Now, with April falling less than expected and May up, some commentators argue that will be enough to offset the impact the extra bank holiday during the Queen’s Platinum Jubilee will have on June’s data, making Q2 GDP flat or even slightly positive. Moreover, the data no longer show GDP falling two straight months after a flat February, which had caused people to extrapolate declines forward. In our view, a Q2 GDP contraction was always more if than inevitable, and we guess the data now just make that a bit clearer (notwithstanding the potential for further revisions, of course).
Exhibit 1: The Ever-Changing UK GDP Data
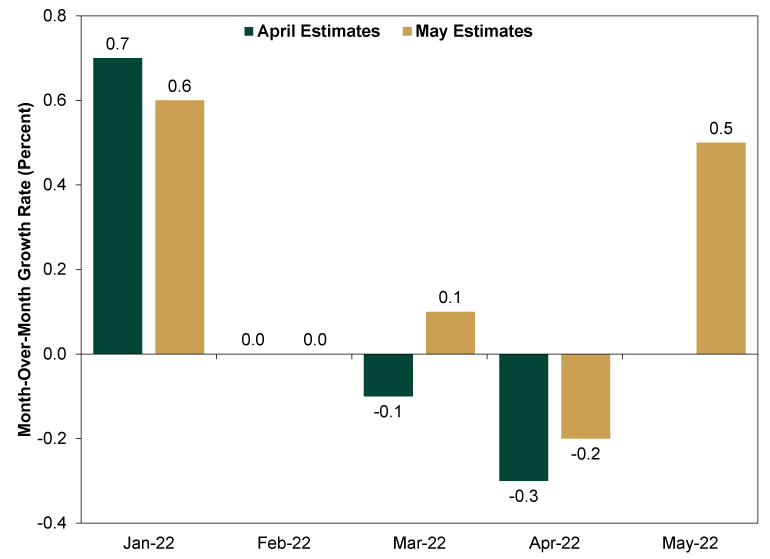
Source: Office for National Statistics, as of 7/14/2022. Numbers are from the official time series accompanying April and May’s monthly GDP reports.
The main reason we hesitated to read much into monthly GDP is the reason underpinning the revision and May’s rebound: volatility in the Human Health & Social Work Activities component. Initially, the Office for National Statistics (ONS) estimated this fell -5.6% m/m in April due to the end of the National Health Service’s (NHS’s) COVID test-and-trace program and vaccination drive.[i] That got revised up to 5.0% in the updated figures, which isn’t a shock: As the ONS noted at the pandemic’s outset, COVID created some statistical and logistical challenges that led to big revisions, due in part to the way NHS activity is tabulated.[ii] That category also was partly responsible for May’s rebound, growing 2.1% as normal doctors’ appointments returned.[iii]
We hesitate to call this category economic activity in the traditional sense of the term. The NHS is a government-run, taxpayer-funded system, with no money changing hands at the point of service and no market price for activity. We say this not to pass judgment for or against, but to point out that when the ONS tallies quarterly GDP, it uses different methodology than monthly. The monthly measure is an output measure—the quantity produced or served. But quarterly GDP is an expenditure measure. Since there are no market expenditures in the vast majority of the UK’s healthcare sector, the ONS imputes a market value based on cost per unit. It is imaginary economic activity, and a set the ONS warns is “challenging” even in normal times, with COVID only adding complexity.[iv]
So when evaluating the economic health of the UK’s mighty services sector, we generally look past health (and education, which has similar measurement challenges) and zoom in on consumer-facing services. There, the picture of how April’s cost-of-living jump affected demand is mixed, with supply shortages muddying the waters. Consumer-facing services growth was revised down to 2.1% m/m in April. Now, it may be tempting to say this is surefire proof that households overcame the sharp increase to the home energy price cap and a suite of tax hikes, but keep in mind that this followed a drop in March, which stemmed from vehicle shortages. So April’s consumer growth at least partly reflected pushed-back demand. That wasn’t the only driver, as personal services also did well, but we think an objective look is important.
In May, consumer-facing services fell -0.1% m/m, with retail, dining and entertainment contributing to the decline. It seems fair to say weaker demand and supply both played roles here, given the many reports of labor shortages and the ongoing dislocations in the global supply chain while China remained under lockdown. But the picture wasn’t entirely bleak. Professional services and transport services rose nicely—and these are output measures, not skewed by inflation. So it may be that continued reopening merely shifted demand from goods to services consumption as people returned to the office.
One month doesn’t make a trend, so it is impossible to know which explanation holds—we will need more data to discern that. We are merely pointing out the many possible interpretations to underscore why making snap judgments on headline data is an error. They are too bouncy, too subject to revision and too open to interpretation to yield much insight. They are also backward-looking. Here we are, in mid-July, parsing data reflecting a month that ended six weeks ago. Meanwhile, stocks are busy looking 3 – 30 months ahead of now. About all the data can do is hint at whether investors have been too pessimistic.
There is every chance they have been and that UK stocks have ample positive surprise power in store. It is also possible a recession is underway, in which case, given the constant drumbeat of recession chatter, stocks probably already reflect a chunk of the weakness. But crucially, nothing here indicates a deep, painful contraction is underway—the sort that would likely take a huge bite out of investment and corporate earnings. Rather, there are pockets of good and bad. That may not mean robust economic growth lies ahead, but it also means negative surprise power should be limited from here.
If you would like to contact the editors responsible for this article, please message MarketMinder directly.
*The content contained in this article represents only the opinions and viewpoints of the Fisher Investments editorial staff.
Get a weekly roundup of our market insights
Sign up for our weekly e-mail newsletter.

You Imagine Your Future. We Help You Get There.
Are you ready to start your journey to a better financial future?

Where Might the Market Go Next?
Confidently tackle the market’s ups and downs with independent research and analysis that tells you where we think stocks are headed—and why.
Related Resources
-
Politics Beyond the War: A Political Roundup Covering America, Canada and Denmark2026-03-17
-
Economics Doubts Aplenty After UK January GDP Flatlined2026-03-17
-
Expert Commentary 3 Things You Need to Know This Week | Fed Meeting, Central Banks, Defense Spending
 2026-03-16
 -
Economics US Data Stronger Under the Hood Than Many Realize2026-03-16


Learn More
Learn why 195,000 clients trust us to manage their money and how Fisher Investments and its affiliates may be able to help you achieve your financial goals.
As of 12/31/2025
New to Fisher? Call Us.
Contact Us Today