Personal Wealth Management /
What to Make of Flagging Consumption
Why we don’t think moribund consumer spending is likely to forestall recovery after economies reopen.

With lockdowns starting to ease, many pundits are shifting their thoughts to possible paths forward. Since consumer spending is almost 70% of US GDP, many questions hinge on consumer behavior. The dominant theme: Fear that plunging consumption in March and April is a prelude to persistent weakness past economies’ reopening as virus worries, high unemployment and rising savings rates flatline spending and quash growth. But in our view, this overrates consumer spending’s variability—even given the current, very unusual economic circumstances.
Retail sales have tanked since shelter-in-place orders spread nationwide, falling -8.3% m/m in March and -16.4% in April.[i] To see the full effect of these twin monthly drops on retail sales—and its major underlying industry groups—Exhibit 1 shows the cumulative percentage change in retail sales from February – April 2020.
Exhibit 1: Percentage Change in Retail Sales Components, February – April 2020
Source: FactSet, as of 5/18/2020. Percentage change in components of US retail sales and food services, February 2020 – April 2020.
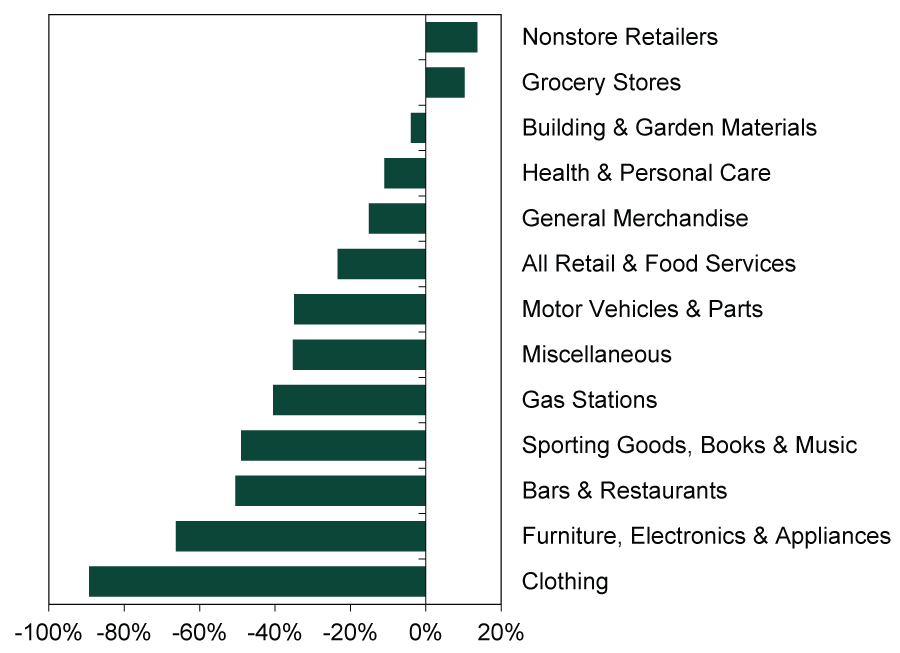
Discretionary items people typically purchase in person (e.g., clothing, furniture and sporting goods) were among the hardest-hit in March and April, as were bars and restaurants. As is probably intuitive to you, non-store retailers—think: e-commerce—have benefited from brick and mortar closures and stay-at-home orders. Grocery stores have gained, too.
But the retail sales report, detailed as it is, doesn’t fully capture American consumers’ behavior. Aside from restaurants, it includes very few services—even though these comprise about two thirds of overall consumer spending. A separate measure—the Bureau of Economic Analysis’s personal consumption expenditures (PCE)—better reflects this. In ordinary times, PCE tends to be far less volatile than retail sales, because many services folks regularly spend money on (health care, utilities, rent/mortgages, etc.) aren’t exactly discretionary. But we aren’t in ordinary times.
No surprise, then, that PCE fell -7.5% m/m in March, with services (-9.5%) driving the decline.[ii] Within services, many categories were weak. Notably, healthcare spending fell -16.1% m/m, while transportation services tumbled -25.5%, led by a -51% plunge in spending on public transit.[iii] Personal care and clothing services also fell sharply, -22.2% m/m, as salons, barbers and other such shops closed.[iv] The pain likely worsens in April, as lockdowns remained in effect throughout the month. The consensus estimate of analysts polled by FactSet calls for PCE to fall -15.0% m/m in the month. Meanwhile, spiking unemployment (to 14.7% in April from 4.4% in March) and savings rates (13.1% in March compared to February’s 8.0%) suggest to some that consumers will likely be unable or unwilling to spend going forward.[v]
Obviously, much of this hinges on society’s reaction to COVID-19. Hence, reopening plans likely have a huge influence on the type of recovery we see. Some key considerations, in our view: How long will business closures and shelter-in-place orders last? How severe will they be in the meantime? As state and local governments lift restrictions, how many firms will operate below capacity in order to permit social distancing at the workplace? If there is a second virus wave, how will society’s response differ? Broad testing availability and progress on treatments and/or vaccines may loom large for each of these. In our view, the answers aren’t knowable now. It is possible renewed lockdowns knock consumer spending again. But we think assigning a probability to this is futile based on what we know today. Further, how it relates to expectations is what matters most for stocks.
In our view, though, whenever the lockdowns lift and normalcy starts to return, consumer spending should prove more resilient than many fear. Historically, high unemployment hasn’t proven much of a hurdle. After the 2007 – 2009 recession ended in June 2009, unemployment didn’t fall below 9% until October 2011, when the broader U-6 rate was hovering around 16%.[vi] But aside from a September 2009 dip, PCE rose every month.[vii]
We think services spending’s less discretionary nature explains why. Last year, housing and utilities accounted for 18.3% of the total.[viii] Transportation services and financial services plus insurance were another 11.2%.[ix] Healthcare added 17.0%.[x] In March and April, with the economy still largely shuttered, payments on many of these usually resilient basics plummeted. But when it reopens, we doubt commuting expenses and payments for healthcare services will stay offline for long. Ditto for personal care. To the extent rent and mortgages see a dip from impacted workers getting a few months’ grace, it likely won’t last. That all argues for a rebound of some sort, particularly off an unusually depressed base.
As for alleged cash hoarding, if consumers save more of their paychecks for a while, the money doesn’t disappear. Savers deposit it at banks, which can lend it out to other consumers or businesses. This is still a productive use—and it can still contribute to economic growth, particularly now when many businesses need credit.
To be clear: We aren’t arguing consumer spending will snap back to all-time highs in a picture-perfect “V.” But that isn’t necessary for stocks to rise and a new bull market to begin (if it hasn’t already). All you need is reality topping fears. Given rampant worries over consumers unable or unwilling to open their wallets, the basic structure of consumer behavior in America suggests those fears won’t be terribly tough to top.
[i] Source: FactSet, as of 5/18/2020.
[ii] Source: Bureau of Economic Analysis, as of 5/18/2020.
[iii] Ibid.
[iv] Ibid.
[v] Sources: US Bureau of Labor Statistics and Bureau of Economic Analysis, as of 5/18/2020.
[vi] Source: Federal Reserve Bank of St. Louis, as of 5/19/2020. Seasonally adjusted unemployment rate and U-6 rate, July 2009 – October 2011.
[vii] Source: Bureau of Economic Analysis, as of 5/19/2020. Month-over-month percentage change in personal consumption expenditures, July 2009 – October 2011.
[viii] Ibid.
[ix] Ibid.
[x] Ibid.
If you would like to contact the editors responsible for this article, please message MarketMinder directly.
*The content contained in this article represents only the opinions and viewpoints of the Fisher Investments editorial staff.
Get a weekly roundup of our market insights
Sign up for our weekly e-mail newsletter.

You Imagine Your Future. We Help You Get There.
Are you ready to start your journey to a better financial future?

Where Might the Market Go Next?
Confidently tackle the market’s ups and downs with independent research and analysis that tells you where we think stocks are headed—and why.
Related Resources
-
Economics A Summertime Check-in on US Consumers2026-07-23
-
Expert Commentary Why Ken Fisher Is Optimistic About European Stocks
 2026-07-23
 -
Politics Blunting Burnham?2026-07-21
-
Market Analysis Why the SOX “Bear Market” Isn’t Foreboding2026-07-21


Learn More
Learn why 210,000 clients trust us to manage their money and how Fisher Investments and its affiliates may be able to help you achieve your financial goals.
As of 6/30/2026
New to Fisher? Call Us.
Contact Us Today