Personal Wealth Management / Economics
Your Economic Two’fer Tuesday
What do good industrial production and disappointing retail sales have in common? Neither means much (if anything) to stocks looking forward.

Continuing a big week in economic data, the US took its turn in the spotlight Tuesday with July retail sales and industrial production. The former stole most headlines, with retail sales’ -1.1% m/m drop in July blamed widely for Tuesday’s market volatility.[i] Pundits portrayed July’s weakness as a portent of worse to come in August, given the Delta variant’s escalation and renewed mask mandates since the calendar flipped. We wouldn’t read that much into either weak retail sales or industrial production’s 0.9% m/m climb, which beat expectations and contained some encouraging nuggets under the hood. Whether good or bad, one month’s economic data don’t make a trend, and we think stocks are looking well beyond summertime results.
To put it bluntly, retail sales’ slide—which missed expectations for a -0.4% drop—wasn’t great. The two main positives were gas stations and restaurants, neither of which is a terribly convincing plus. Gas station sales tend to rise and fall with gas prices, which are up, so that 2.4% rise probably stole demand from other categories.[ii] Restaurant sales’ 1.7% increase (on the heels of June’s 2.4% rise) should be an encouraging sign of services’ continued recovery, but with mask mandates returning in several major metro areas in August, the boomlet could be short-lived.[iii]
But context matters for the other categories, too. Exhibit A: Sales of autos and auto parts, which fell -3.9% m/m, extending their ongoing decline.[iv] Auto sales are weak not because of low demand, but because of low supply tied to the ongoing semiconductor shortage. Excluding that category, retail sales fell just -0.4% m/m, which is a little better than May’s print.[v] That, you might recall, was not a sign of terrible things to come. Elsewhere in the report, it is hard to see the results as anything other than normal data variability. Clothing stores’ -2.6% drop followed June’s 3.7% rise, which was inflated by office reopenings and workers’ need to update their professional wardrobes after a year and a half of remote work.[vi] Home improvement and garden store sales have been weak for a few months, tied to the DIY boom fizzling as lockdowns ended.
So, overall, we think the right move now is to take a deep breath and not get too hung up on one seemingly bad month. Wobbly economic data are the norm, not the exception, even during economic expansions. Moreover, the springtime’s big reopening bounce set a rather high benchmark. Even with July’s decline, retail sales are still 17.2% above the pre-pandemic high.[vii] In past commentaries, we took issue with widespread expectations for “stimulus” to send consumption to a permanently higher plateau and usher in a new Roaring Twenties. We thought then that any big spending boom was probably temporary, and perhaps we are now seeing that play out. In our view, that isn’t reason to jeer, just a sign that distortions are slowly dropping out of the data.
As for industrial production, you can apply much the same logic: Context and trends are important. Total production’s 0.9% rise, which beat expectations for 0.5%, brings output closer to pre-pandemic levels.[viii] That figure includes utilities’ -2.1% drop, which stemmed from weather, so looking at pure manufacturing strikes us as more meaningful.[ix] That rose 1.4% m/m, finally bringing factory output above pre-pandemic levels, but manufacturing remains a hair below its actual peak set in 2018.[x] Under the hood, output got a big boost from the 10.8% jump in production of automotive products, which augurs well for supply in the near term at least.[xi] But we think it would be premature to declare the auto shortage over, considering how bouncy this series has been since last year. Better for now, in our view, to tip our hat to one nice month and move on.
Perhaps more meaningful is the continued recovery in capacity utilization, which is now back above pre-pandemic levels for manufacturing. Capacity utilization, as the name implies, is the percentage of the nation’s factory capability being put to work. As Exhibit 1 shows, that was running around 76% for about a year before pandemic lockdowns sent it off a cliff in February and March 2020.[xii] The initial recovery was equally sharp, but then it slowed down, taking more than a year to return to normal. In our view, this illustrates a point often lost in discussions of lockdowns’ economic impact: Restarting economic activity is a lot more difficult than shutting it off.
Exhibit 1: Manufacturing Capacity Utilization’s Long and Winding Road
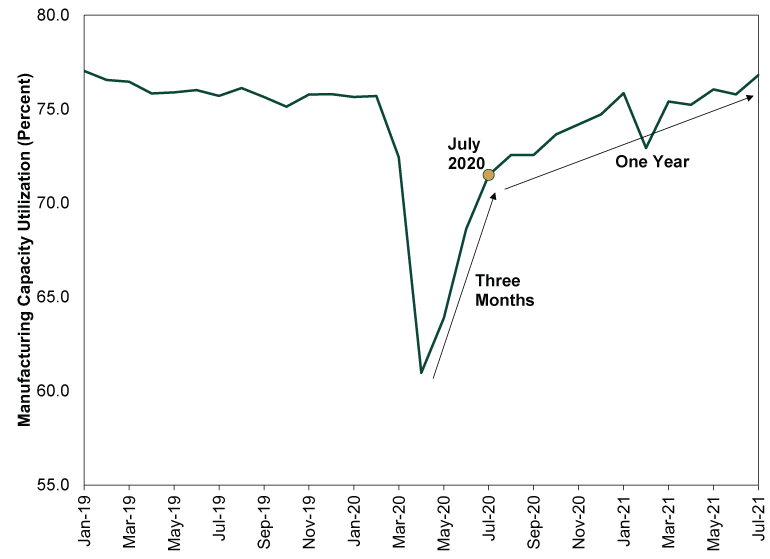
Source: FactSet, as of 8/17/2021.
Still, it is important to have reasonable expectations looking forward. Just because factory operations are largely back to normal doesn’t mean everything will be hunky dory from here. As manufacturing purchasing managers’ indexes have shown, while demand is strong (as measured by new orders) supply chain issues are still rearing their ugly heads. Factories still face long waits for parts and raw materials, which has caused unfilled orders to pile up. The shortage of truck drivers adds another wrinkle, as do the mounting sea freight delays globally as ports in China, Vietnam and elsewhere in developing Asia deal with their own Delta variant battles. Therefore, it wouldn’t surprise us to see industrial production fluctuate from month to month looking forward.
Crucially, though, stocks are well aware of all of this. Shipping problems have dominated headlines right alongside the Delta variant’s US surge. But daily volatility notwithstanding, stocks are largely seeing through it. In our view, markets are likely doing what they always do: looking past the short term and weighing the likely reality over the next 3 – 30 months overall. Scattered mask mandates, COVID flareups and developing world lockdowns in the here and now likely don’t mean a lot for total economic activity over the next year or two. Plus, with dreary headlines keeping sentiment in check, we think reality should have ample room to beat expectations.
If you would like to contact the editors responsible for this article, please message MarketMinder directly.
*The content contained in this article represents only the opinions and viewpoints of the Fisher Investments editorial staff.
Get a weekly roundup of our market insights
Sign up for our weekly e-mail newsletter.

You Imagine Your Future. We Help You Get There.
Are you ready to start your journey to a better financial future?

Where Might the Market Go Next?
Confidently tackle the market’s ups and downs with independent research and analysis that tells you where we think stocks are headed—and why.
Related Resources
-
Market Analysis The New Tariffs in Town Are Still Old News2026-07-24
-
Expert Commentary This Week in Review | Market Volatility, Tariffs, SpaceX
 2026-07-24
 -
Economics A Summertime Check-in on US Consumers2026-07-23
-
Expert Commentary Why Ken Fisher Is Optimistic About European Stocks
 2026-07-23


Learn More
Learn why 210,000 clients trust us to manage their money and how Fisher Investments and its affiliates may be able to help you achieve your financial goals.
As of 6/30/2026
New to Fisher? Call Us.
Contact Us Today