


Personal Wealth Management / Market Volatility
Understanding Bull Markets

A bull market is a sustained period of generally rising stock prices. Capturing a bull market’s returns is important for long-term investors seeking to reach their long-term financial goals. However, a bull market is not volatility free—pullbacks and corrections can occur while the broader stock market remains in a bull market.
Understanding how a bull market works can help investors put short-term market movement in context. This article explains bull market characteristics, factors that can contribute to a bull market, how bull markets compare with bear markets and why discipline matters across market cycles.
What Is a Bull Market?
Bull markets are periods—typically multiple years—when stock prices generally rise. Equity market indexes and asset prices trend upward over this time, even though stocks may decline for days, weeks or even longer stretches along the way.
It’s crucial to understand that bull markets don’t rise in a straight line. Stocks normally encounter bumps or drops along the way, usually driven by sentiment-driven fears. Some of these bull market drops are classified as “corrections.”
What Is a Market Correction?
Corrections are short, sentiment-driven drops of 10% to 20%, which often start quickly. Because they are usually fear-driven, they can happen at any time for any or no reason and are normally sharp and swift. When they are over, stock prices often quickly resume their upward trend, which can make trying to time bull market corrections a futile exercise.
Bull Market vs. Bear Market
A bull market and a bear market represent different directional periods within a market cycle:
- Bull market: A period of generally rising stock prices, often coinciding with improving investor confidence and economic fundamentals.
- Bear market: A stock market decline of 20% or more from a previous all-time high, often driven by deteriorating economic fundamentals or a large, unforeseen event that has the size to take trillions of dollars off the global economy.
Key Characteristics of a Bull Market
No two bull markets unfold in precisely the same way, but several characteristics commonly appear over the course of a bull run:
- Rising stock prices over time: The defining feature of a bull market is an upward trend in stock market prices over a sustained period.
- Improving investor confidence: A bull market often begins while sentiment is still pessimistic. As prices rise, investor confidence and participation tend to gradually improve.
- Economic growth: Economic expansion can support a bull market, but stocks do not require strong economic growth to rise. Even modest growth, when it exceeds low expectations, can help push stock prices higher.
- Changing leadership: Different sectors, styles, regions or individual stock categories may lead at different points during the market cycle. Leadership within a bull market is rarely uniform.
The Stages of Investor Sentiment
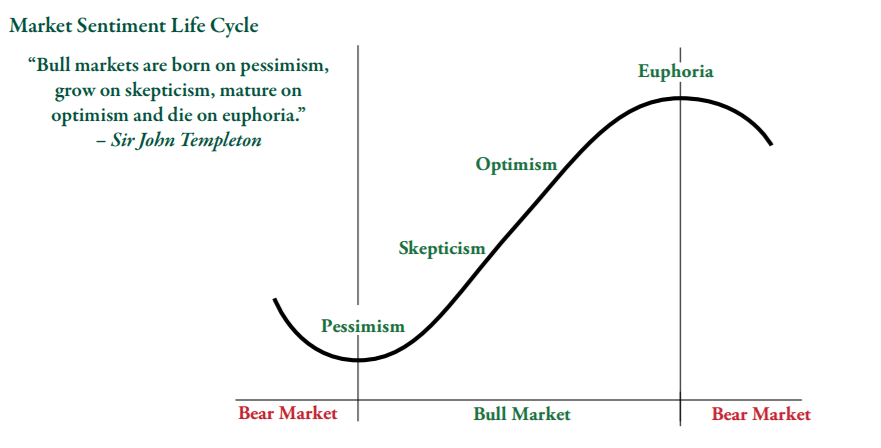
When you look at historical charts, it may appear easy to stay invested during a bull market from bottom to top. Investors are often unaware of the potentially counter-intuitive or contrarian nature of investor sentiment. Sir John Templeton described investor sentiment and its relation to the market cycle, saying, “Bull markets are born on pessimism, grow on skepticism, mature on optimism and die on euphoria.”
Exhibit 1: The Market Sentiment Life Cycle
Market Sentiment Life Cycle Exhibit Long Description
This illustration shows the market sentiment life cycle, a concept describing how investor sentiment evolves as a bull market unfolds. The image is a rising curve that moves upward from left to right, representing stock prices climbing over time. It doesn't reflect actual returns. It's meant to illustrate a point.
Four investor sentiment stages sit along the curve. At the lowest point, near the end of a bear market and beginning of a new bear market, sentiment is at its most negative. This is pessimism. As prices start to rise steadily, the next stage is skepticism, when many investors are hesitant. Further up the curve, sentiment turns to optimism, as rising prices draw more investors in and expectations climb. At the top of the curve sits euphoria, when investors grow overconfident and often ignore underlying problems.
The stages follow a well-known idea from investor Sir John Templeton: bull markets are born on pessimism, grow on skepticism, mature on optimism and die on euphoria.
The takeaway is that emotions often work against investors. Pessimism runs highest right when a bull market is about to begin, and euphoria peaks just as it's ending. Recognizing these stages may help you avoid reacting emotionally and staying on track toward your long-term goals.
The above is intended to illustrate a point and does not reflect actual returns or market behavior.
1. Pessimism
Investors are often most pessimistic at or near the bottom of a bear market. After the stock market has endured a sustained downward trend, investors tend to have overly dour expectations—a sign of pessimism.
2. Skepticism
When prices begin to rise consistently, skepticism begins, as folks are hesitant to invest again. Despite widespread skepticism, companies may continue beating overly dour expectations as prices rise. Over time, that can draw more investors back into the market, helping to gradually warm sentiment.
3. Optimism
During optimism, stocks are generally on a stable upward trajectory over time, investors raise expectations for regular company earnings and investors start to develop a fear of missing out on future returns.
4. Euphoria
The final stage in Templeton’s cycle is euphoria. As investors throw caution to the wind and look for the next hot investment, euphoria can lead them to dismiss fundamental economic issues and continue to look for reasons why the market should continue rising.
In Fisher Investments’ view, emotions and biases can work against investors. Because market movements can feel counterintuitive, investors may be tempted to sell stocks at the wrong time instead of sticking with a disciplined long-term plan. Making poorly-timed investment decisions based on emotion can threaten your ability to achieve your longer-term investment goals.
We’re here to help throughout the market cycle
Request an Appointment
How Long do Bull Markets Last?
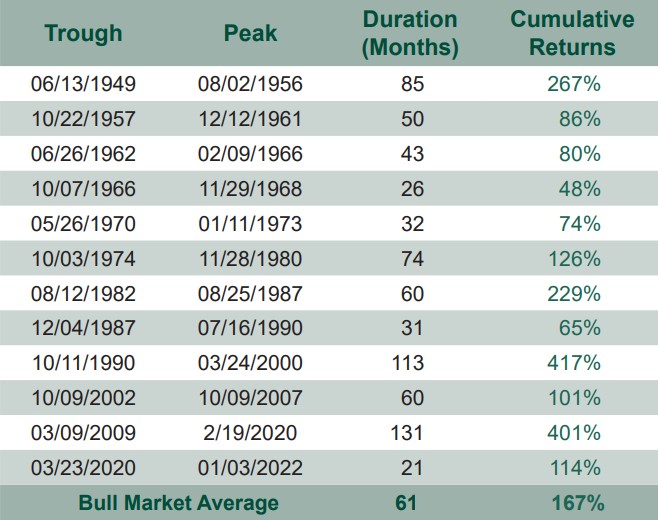
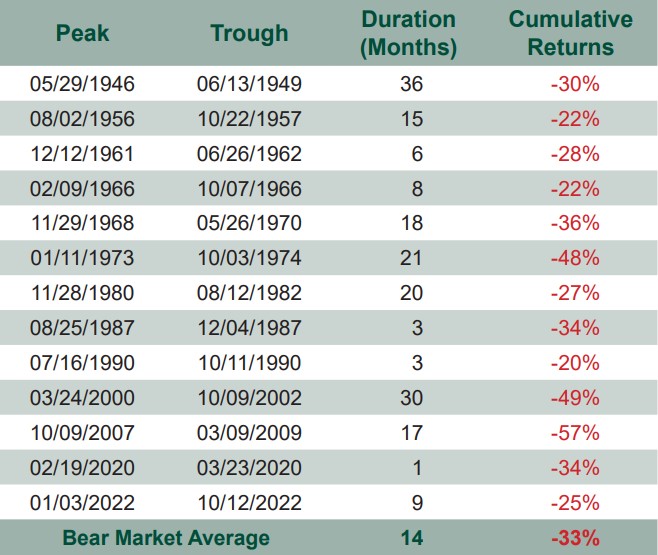
Bull markets vary in duration and returns, but history has shown that they last longer and the returns are stronger, on average, than bear markets’ losses. As shown in Exhibit 2, the last 12 S&P bull markets displayed lasted an average of 61 months and delivered average cumulative returns of 167%.1 By comparison, the 13 bear markets since 1946 (Exhibit 3) lasted an average of 14 months and produced average cumulative declines of 33%.2
Exhibit 2: Last 12 S&P Bull Markets
S&P 500 Bull Markets Exhibit Long Description
This image-based exhibit shows the last 12 bull markets for the S&P 500 Price Index since 1949. A bull market is a period, usually lasting years, when stock prices generally rise. For each bull market, the table shows the start date, end date, duration in months and cumulative price return. A month equals 30.5 days.
The 12 bull markets are as follows:
June 13, 1949 to August 2, 1956: 85 months, 267% return.
October 22, 1957 to December 12, 1961: 50 months, 86% return.
June 26, 1962 to February 9, 1966: 43 months, 80% return.
October 7, 1966 to November 29, 1968: 26 months, 48% return.
May 26, 1970 to January 11, 1973: 32 months, 74% return.
October 3, 1974 to November 28, 1980: 74 months, 126% return.
August 12, 1982 to August 25, 1987: 60 months, 229% return.
December 4, 1987 to July 16, 1990: 31 months, 65% return.
October 11, 1990 to March 24, 2000: 113 months, 417% return.
October 9, 2002 to October 9, 2007: 60 months, 101% return.
March 9, 2009 to February 19, 2020: 131 months, 401% return.
March 23, 2020 to January 3, 2022: 21 months, 114% return.
The data covers the start and end dates of each bull market, its duration in months and its cumulative price return as a percentage. Across all 12 periods, bull markets averaged more than five years in length (61 months) and delivered a cumulative return of 167% for the S&P 500 Price Index.
The clear pattern is that bull markets have tended to run for a long time and reward patient investors with substantial gains. Compared with bear markets, they have lasted longer and produced stronger returns on average.
The takeaway is that staying invested through a bull market has historically paid off. Because these periods often last several years and build significant returns, stepping out early may cost you growth you need for your long-term goals.
Exhibit 3: Last 13 S&P Bear Markets
S&P 500 Bear Markets Exhibit Long Description
This table shows the last 13 bear markets for the S&P 500 Price Index since 1946. A bear market is a period when stock prices fall 20% or more, driven by fundamental problems. For each bear market, the table shows the start date, end date, duration in months and total decline. A month equals 30.5 days.
The 13 bear markets are as follows:
May 29, 1946 to June 13, 1949: 36 months, -30% decline.
August 2, 1956 to October 22, 1957: 15 months, -22% decline.
December 12, 1961 to June 26, 1962: 6 months, -28% decline.
February 9, 1966 to October 7, 1966: 8 months, -22% decline.
November 29, 1968 to May 26, 1970: 18 months, -36% decline.
January 11, 1973 to October 3, 1974: 21 months, -48% decline.
November 28, 1980 to August 12, 1982: 20 months, -27% decline.
August 25, 1987 to December 4, 1987: 3 months, -34% decline.
July 16, 1990 to October 11, 1990: 3 months, -20% decline
March 24, 2000 to October 9, 2002: 30 months, -49% decline.
October 9, 2007 to March 9, 2009: 17 months, -57% decline.
February 19, 2020 to March 23, 2020: 1 month, -34% decline.
January 3, 2022 to October 12, 2022: 9 months, -25% decline.
Looking across these periods, bear markets have averaged a decline of 33% and lasted an average of 14 months. That's shorter than the average bull market, which has run more than five years.
The pattern here is that bear markets, while painful, have historically been shorter and less frequent than the bull markets that follow them. Their declines have also been smaller on average than the cumulative gains bull markets have delivered.
The takeaway is that downturns tend to be temporary. Selling out of fear near a market low often locks in losses and risks missing the early rebound of a bull market, which can set back your progress toward long-term goals.
Source: Global Financial Data, as of 6/10/2026; S&P 500 Index Price Level from 5/29/1946 – 12/30/2013. FactSet, as of 6/10/2026; S&P 500 Index Price Level from 1/1/2014 – 10/12/2022. For “Duration,” a month equals 30.5 days.
What Bull Markets Mean for Investors
Bull markets can create meaningful opportunities for long-term growth, but benefiting from them often requires staying invested through periods of uncertainty.
One of the challenges investors face is that bull markets rarely begin when confidence is high. After a market decline, many people remain cautious and wait for an “all clear” signal, or additional proof that conditions have improved before reinvesting. Waiting for the “all clear” signal often comes with significant opportunity cost. By the time it arrives, a significant portion of the recovery has likely already occurred.
This is why emotional reactions to market volatility can be costly. Investors who sell during downturns must make two decisions: when to get out and when to get back in. While avoiding short-term losses may feel prudent, missing the early stages of a bull market can have a lasting impact on long-term returns.
Risk and opportunity are inherently linked. The potential for growth is one of the rewards investors seek for accepting market risk. Focusing too heavily on short-term fluctuations and market volatility may increase the risk of missing the long-term growth needed to achieve financial goals.
For many investors, maintaining a long-term perspective and avoiding emotionally driven decisions can be just as important as identifying investment opportunities themselves.
Looking for comprehensive wealth management across market cycles?
Request an Appointment
Putting Bull Markets in Perspective
Bull markets provide important opportunities for portfolio growth, but they also include risk, volatility and changing sentiment. Understanding how bull markets develop, how they differ from bear markets and how investors may react to pullbacks can help place short-term market conditions in a longer-term context.
At Fisher Investments, we help our clients navigate markets, supporting them on their journey towards their long-term goals and objectives. To learn more about how Fisher Investments can help you achieve your long-term goals, download one of our guides or speak with one of our experienced professionals today.
Bull Market FAQs
What Causes a Bull Market?
A bull market begins when reality turns out better than investors' widely held expectations, often while investor sentiment remains pessimistic in the midst of a bear market. Economic growth, corporate earnings, political conditions and changing expectations may all contribute as a bull market develops.
Can You Predict a Bull Market?
Investors can analyze market conditions and develop views about market direction, but they cannot predict every bull—or bear—market reliably. A long-term plan should account for the possibility that a market forecast may be wrong.
How Long do Bull Markets Last?
Historically, bull markets have varied considerably in duration, but on average, since 1946, S&P 500 bull markets averaged 61 months in duration.
What Is the Difference Between a Bull Market and a Bear Market?
A bull market is a sustained period of generally rising stock prices. A bear market is a fundamentally-driven decline in markets of roughly 20% or more from a prior high.
What Should Investors do in a Bull Market?
During a bull market, investors should focus on their long-term goals, diversification and risk tolerance to provide a disciplined framework for evaluating market developments, including market volatility that is common within bull markets. Being invested during a bull market is typically critical for most investors to achieve the growth required to reach their long-term goals.
This article is for informational and educational purposes only and should not be construed as investment advice or a recommendation regarding any particular investment strategy or course of action. The information presented is general in nature and does not take into account the individual circumstances, objectives, or financial situation of any specific investor. We provide our general comments to you based on information we believe to be reliable. There can be no assurances that we will continue to hold this view; and we may change our views at any time based on new information, analysis or reconsideration. Some of the information we have produced for you may have been obtained from a third-party source that is not affiliated with Fisher Investments.
1 Global Financial Data, as of 6/10/2026; S&P 500 Index Price Level from 5/29/1946 – 12/30/2013. FactSet, as of 6/10/2026; S&P 500 Index Price Level from 1/1/2014 – 1/3/2022. For “Duration,” a month equals 30.5 days.
2 Source: Global Financial Data, as of 6/10/2026; S&P 500 Index Price Level from 5/29/1946 – 12/30/2013. FactSet, as of 6/10/2026; S&P 500 Index Price Level from 1/1/2014 – 10/12/2022. For “Duration,” a month equals 30.5 days.

Where Might the Market Go Next?
Confidently tackle the market’s ups and downs with independent research and analysis that tells you where we think stocks are headed—and why.
Insights & Media
-
Politics Context for the Noisy Congress to Come2026-10-09
-
Interesting Market History Notes on a Bear Market Anniversary2026-10-09
-
Economics Checking in on US Consumers2026-10-08
-
Politics Two Elections in the Americas—and Spain’s Coming Snap Vote2026-10-06





Learn More
Learn why 210,000 clients trust us to manage their money and how Fisher Investments and its affiliates may be able to help you achieve your financial goals.
As of 9/30/2026
New to Fisher? Call Us.
Contact Us Today