Personal Wealth Management / Economics
$100 Oil Probably Isn’t a Tipping Point
Why we think surging fuel costs can hurt people’s pocketbooks, but not the economy.
With the tragic events unfolding in Ukraine right now, financial market and budget impacts may seem small in comparison. Nevertheless, the conflict and the international community’s response have helped spur oil prices to climb, and with them, petrol prices—which we have observed is a real financial concern to many in the UK as oil bounces around $100 (£77) per barrel, whilst the national average petrol price is near 167 pence per litre.[i] In the minutes of its 17 March meeting, the Bank of England warned higher energy costs would “accentuate both the peak in inflation and the adverse impact on activity by intensifying the squeeze on household incomes.”[ii] As we wrote a few weeks ago, oil’s latest spike seems mostly sentiment-driven to us, and longer-term supply and demand drivers still suggest prices should stabilise sooner rather than later, even with uncertainty surrounding Russian oil supply roiling markets. Regardless, oil’s hitting any level has no direct bearing on broader economic activity, in our view: Its rise and recent surge don’t automatically foretell weaker growth.
Our research shows the UK economy doesn’t have a set relationship with oil prices. When oil spent much of 2011 – 2014 above $100 (£77), no recession (broad-based decline in economic activity) ensued.[iii] Conversely, whilst high oil coincided with recession in 2008 – 2009, we think the issue then was US accounting rules’ incinerating bank capital unnecessarily and the American government’s (in our opinion) haphazard, panic-sowing response that led to UK bank nationalisations and sharp drops in private sector lending—not oil.[iv]
Second, the popular reason commentators we follow say oil allegedly dictates the UK economy’s direction is flawed, in our view. In the US and UK alike, many of them argue high fuel prices undercut consumer spending. Yet from an overall economic perspective, fuel costs still count as spending, contributing positively to gross domestic product (GDP, a government measure of national output). Not that we think GDP is the be-all, end-all, but casting high oil prices as an automatic economic negative isn’t accurate. Rather, according to our analysis, higher fuel and energy costs change where people spend money—perhaps more goes to petrol and electricity, with less spent on leisure and non-essential items. Whilst we agree this creates winners and losers, mathematically, it doesn’t cause recessions. One way to see this is Exhibit 1, which shows UK household expenditures’ ongoing recovery, even with oil’s climb to $77 (£58) last year from $48 (£37) per barrel starting 2021.[v]
Exhibit 1: Higher Oil Doesn’t Seem to Be Bothering Consumer Spending
Source: FactSet, as of 18/3/2022. Household final consumption expenditure, Q4 2019 – Q4 2021.
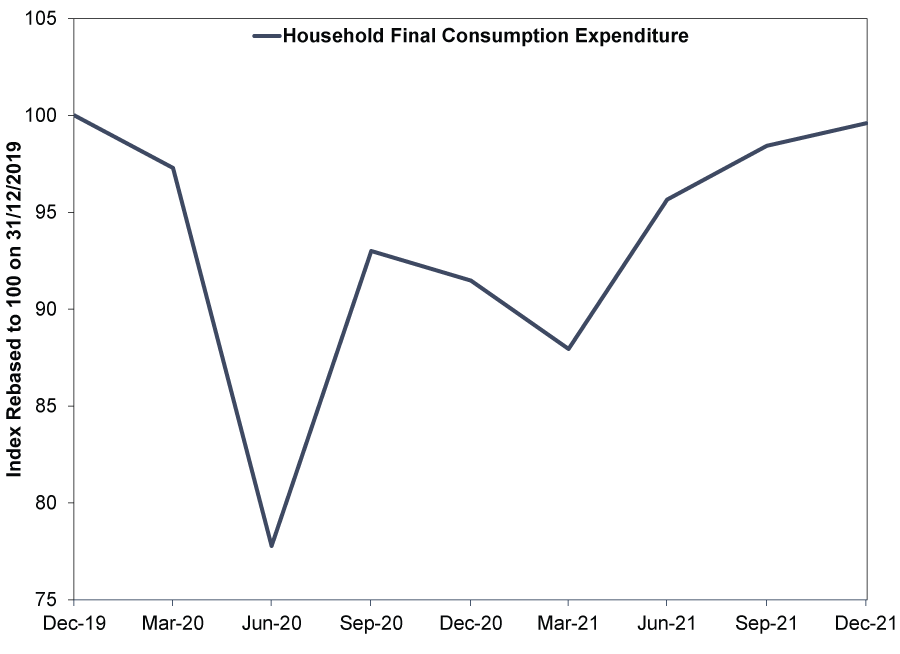
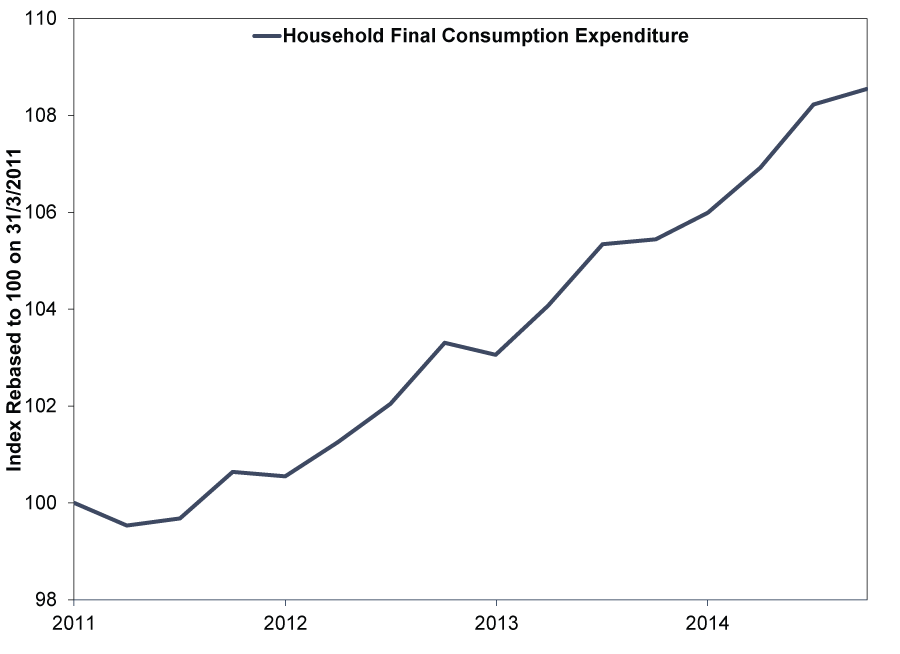
Exhibit 2 shows how household consumption behaved the last time oil prices rose above $100 (£77) per barrel. On 1 February 2011, Brent crude hit $100 and stayed mostly above that until oil’s collapse in September 2014, rising as high as $128 (£98) on 13 March 2012.[vi] Consumer spending rose overall through the period.
Exhibit 2: It Didn’t Appear to Hurt When Oil Was Last Over $100
Source: FactSet, as of 18/3/2022. Household final consumption, Q1 2011 – Q4 2014.
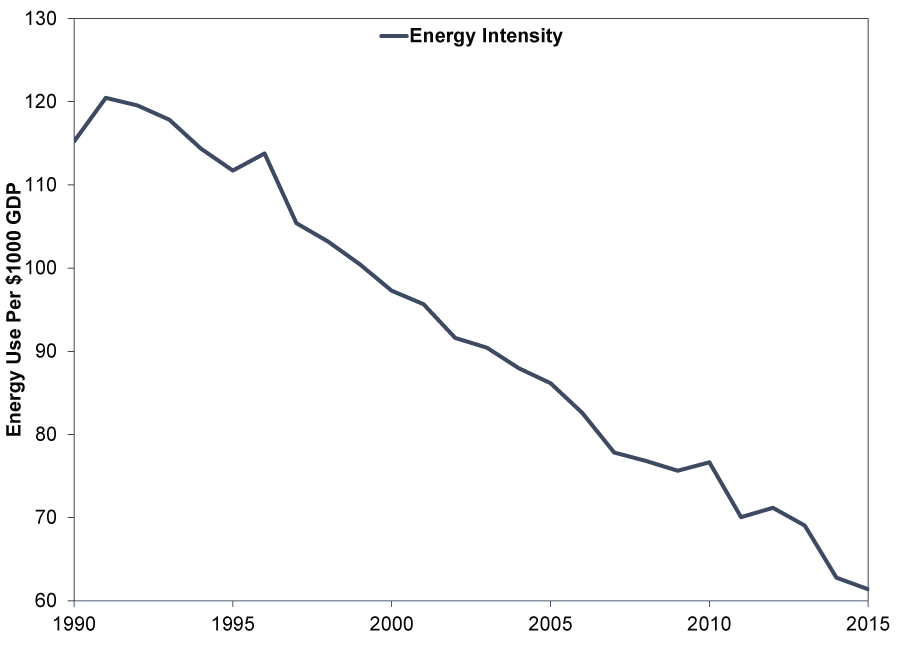
Third, a big reason why we don’t think oil is hampering growth: The UK economy is less energy-dependent than it was in decades past. Whilst rising fuel costs aren’t great, the oil required to produce a given amount of GDP—the economy’s energy intensity—has fallen. (Exhibit 3) Some commentators we follow say it isn’t any particular oil price level per se that causes recession, but its sudden acceleration. Supposedly, in their view, people can’t adapt quickly enough, which creates enough damage to precipitate an economic downturn. Whilst we think this may have been a factor three decades ago, with oil use per unit of GDP half levels from the early 1990s, the effect today appears likely to be far smaller.[vii]
Exhibit 3: Energy Intensity Has Fallen Sharply
Source: World Bank, as of 18/3/2022. UK energy use (kilograms of oil equivalent) per $1,000 GDP, 1990 – 2015.
We think the UK’s energy efficiency is underappreciated, and as a corollary, oil swings’ effect on the economy is often overrated. Spiking oil prices today are a far cry from 30 years ago in their economic sway, based on our research. Rather than a dagger to the economy, we think they are at most a speed bump. That isn’t to dismiss the hardship they present for many households, particularly lower-income households, but in our experience, stocks tend not to dwell on the sociological implications like this. Rather, they have a colder eye, which is why it is beneficial for investors to assess these matters coolly and rationally, in our view.
As Fisher Investments worldwide Founder Ken Fisher has written recently, we think developments in Europe—which is the swing factor pertaining to oil supply—are worth watching. But, as he noted, they aren’t worth overrating, either, in our view. We see little reason to think oil hovering near where it was during an expansion around eight years ago is automatically troubling today.
[i] “Petrol and Diesel Prices in the UK | Latest Fuel Price Data From the RAC,” Staff, RAC Drive, 20/3/2022.
[ii] “Monetary Policy Summary and Minutes of the Monetary Policy Committee Meeting,” Bank of England, 17/3/2022.
[iii] Source: FactSet, as of 16/3/2022. Statement based on Brent crude oil price per barrel 1/2/2011 – 4/9/2014, and UK GDP, Q1 2011 – Q4 2014.
[iv] Source: Bank of England, as of 18/3/2022. Monetary financial institutions sterling net lending to private non-financial corporations and household sector, June 2008 – December 2008.
[v] Source: FactSet, as of 15/3/2022. Brent crude oil price per barrel, 31/12/2020 – 31/12/2021.
[vi] Ibid. Brent crude oil price per barrel, 1/2/2011 – 4/9/2014.
[vii] Source: World Bank, as of 18/3/2022. UK energy use (kilograms of oil equivalent) per $1,000 GDP, 1990 – 2015.
Get a weekly roundup of our market insights.
Sign up for our weekly e-mail newsletter.

You Imagine Your Future. We Help You Get There.
Are you ready to start your journey to a better financial future?

Markets Are Always Changing—What Can You Do About It?
Get tips for enhancing your strategy, advice for buying and selling and see where we think the market is headed next.
Related Resources
-
Market Analysis Why El Niño Doesn’t Necessitate Portfolio Shifts2026-07-02
-
Market Analysis Today in Brexit, Day 3,652: Brexit Turns 102026-06-24
-
Market Analysis Reviewing America’s Q1 Earnings and What Q2 Expectations Say2026-06-23
-
Politics Revolving Door Turns, Uncertainty Starts Falling2026-06-23


Contact Us
Learn why 200,000 clients trust Fisher Investments and its affiliates to manage their money and find out how we may be able to help you achieve your financial goals.
As of 31/03/2026. Includes Fisher Investments and its affiliates.
New to Fisher? Call Us.
Contact Us Today