Personal Wealth Management / Market Analysis
Digging Into US Services Industry Data
In our view, December’s decline didn’t give investors new information.
In recent months, a curiosity has emerged in US economic data—a split between the two competing purchasing managers’ indexes (PMIs, surveys of growth’s breadth) for the services sector.[i] Whilst the Institute for Supply Management’s (ISM’s) readings remained in expansion, S&P Global’s started contracting in July and stayed there, below the 50 mark indicating more firms contracted than grew, the rest of the year. But now the divergence is no more, as ISM reported Friday that its services gauge also slipped into contraction in December. Barely, at 49.6, but down nonetheless.[ii] Given the ISM Services PMI’s relatively lower monthly variability and tendency to contract only when recession strikes, this development got plenty of attention from financial commentators we follow.[iii] However, we don’t think it revealed anything new for stocks.
Exhibit 1 shows the growing split between ISM and S&P’s Services PMIs last year. As you will see, even before they diverged directionally, S&P’s was usually a few points below ISM’s.
Exhibit 1: A Tale of Two Services PMIs
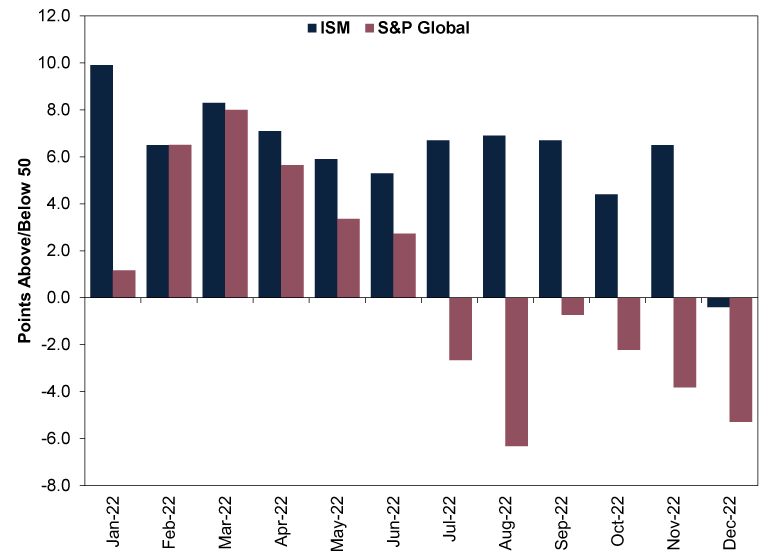
Source: FactSet, as of 9/1/2023.
After looking at the two surveys’ methodologies, we found a couple of reasons for the divergence. One, their industry compositions differ.[iv] Two, S&P Global’s headline services reading isn’t an amalgamation of multiple survey questions, as ISM’s is—it is just the output reading.[v] From that standpoint, the split actually continued in December, as ISM’s Services Output subindex hit 54.7.[vi] That is down 10 points from November, but it remains expansionary. However, we don’t think this is a good reason to dismiss the report. In our view, output is a coincident indicator. So if more forward-looking components drove ISM’s headline contraction, we think that would be well worth digging into. And it is what happened in December, with new orders—which our research suggests represent future production—leading the way down, slipping from 56.0 in November to 45.2.[vii]
Helpfully, ISM gives us an avenue to dig further: Its press release states, in general terms, which industries grew. Interestingly, 11 of the 17 covered industries reported growth.[viii] ISM doesn’t publish industry-specific index numbers, so we don’t know how widespread growth was within these categories. But the growth column includes all of the following: Retail Trade; Health Care and Social Assistance; Utilities; Public Administration; Arts, Entertainment and Recreation; Mining; Accommodation and Food Services; Transportation and Warehousing; Management of Companies and Support Services; Professional, Scientific and Technical Services; and Finance and Insurance.[ix] Together, these represent a quite large swath of America’s service sector.[x]
Meanwhile, in the contraction column, there was Real Estate, Rental and Leasing; Wholesale Trade; Other Services; Information; Construction; and Educational Services.[xi] A minority of industries, so if their troubles were great enough to pull the whole index slightly negative, we think it stands to reason they had a difficult month. However, whether that tough month repeats from here is an open question, in our view.
Even if it does, we don’t think there is any new information here. Based on our read of American financial commentary, US real estate’s troubles are well known, and warnings of a brewing stock in the housing market have hogged headlines for months now. Home prices have started rolling over.[xii] Home sales, housing starts and building permits have been weak for months.[xiii] We think it seems obvious that this would all show up in the real estate and construction portions of the Services PMI. Similarly, Tech and Tech-like firms have been announcing hiring freezes and job cuts for months, and their earnings and revenues have been under financial commentators’ (proverbial) microscope since the pandemic.[xiv] So here, too, we find the Services PMI is simply telling us what we already knew. The same applies for wholesale trade, as commentators we follow have highlighted inventory gluts at warehouses and distribution centres for months.[xv] And the monthly consumer spending report has shown occasional weakness in education services spending and the various categories that comprise “other services” since summer.[xvi]
In our view, there is ample reason to believe markets already reflect all of this, and not just because the mild bear market US stocks have endured to date is consistent with stocks’ pre-pricing in a recession.[xvii] Information Technology, the Tech-like portion of Communication Services and Real Estate all fell more than the market last year, which we find consistent with their driving the contractionary PMI now.[xviii] To us, this is just another indication that a recession, should we actually get one, would have little surprise power.
Our research suggests stocks look forward, to the next 3 – 30 months or so. In our view, that means they are likely looking well beyond all the headwinds shown in the Services PMI. They are probably also looking at politics and increased gridlock under the newly split US Congress, which we think reduces uncertainty by limiting the likelihood of big legislation creating winners and losers. To us, it all adds up as a high likelihood that, if anything, getting confirmation of a recession would end the will-we-or-won’t-we uncertainty, giving stocks clarity and helping them move on.
[i] Source: FactSet, as of 9/1/2023. PMIs are monthly surveys that track the breadth of economic activity. Readings above 50 indicate expansion, below 50, contraction.
[ii] Ibid.
[iii] Source: FactSet, as of 9/1/2023. Statement based on ISM Services PMI – United States, 31/7/1997 – 9/1/2023.
[iv] Source: Institute for Supply Management and S&P Global, as of 3/8/2022.
[v] Ibid.
[vi] Source: FactSet, as of 9/1/2023.
[vii] Ibid.
[viii] Source: Institute for Supply Management, as of 9/1/2023. Services ISM Report On Business, December 2022.
[ix] Ibid.
[x] Source: US Bureau of Economic Analysis, as of 9/1/2023. Statement based on Real Gross Domestic Product by Industry Group, 29/9/2022.
[xi] See note viii.
[xii] Source: FactSet, as of 9/1/2023. Statement based on S&P/Case-Shiller US National Home Price Index, 30/6/2022 – 31/10/2022.
[xiii] Source: US Census Bureau, as of 20/12/2022. Statement based on Monthly New and Existing Residential Sales, Monthly New Residential Construction, November 2022 and Monthly Private Building Permits, August 2022 – November 2022.
[xiv] “Silicon Valley Layoffs Go From Bad to Worse,” Catherine Thorbecke, CNN, 9/1/2023.
[xv] “Retailers Suffer From Inventory Bloat as US Consumers End Two-Year Spree,” Augusta Saraiva, Bloomberg, 18/8/2022. Accessed via Advisor Perspectives.
[xvi] Source: US Bureau of Economic Analysis, as of 9/1/2023.
[xvii] Source: FactSet, as of 10/1/2023. S&P 500 total return, in USD, 3/1/2022 – 10/1/2023. Currency fluctuations between the dollar and pound may result in higher or lower investment returns. A bear market is a prolonged, fundamentally driven broad equity market decline of -20% or worse.
[xviii] Ibid. Statement based on S&P 500 sector total returns, in USD, relative to the overall S&P 500 total return, in USD, 31/12/2021 – 30/12/2022. Currency fluctuations between the dollar and pound may result in higher or lower investment returns.
Get a weekly roundup of our market insights.
Sign up for our weekly e-mail newsletter.

You Imagine Your Future. We Help You Get There.
Are you ready to start your journey to a better financial future?

Markets Are Always Changing—What Can You Do About It?
Get tips for enhancing your strategy, advice for buying and selling and see where we think the market is headed next.
Related Resources
-
Politics Beyond the War: A Political Roundup Covering America, Canada and Denmark2026-03-18
-
Economics Doubts Aplenty After UK January GDP Flatlined2026-03-18
-
Environmental, Social and Governance Insights Responsible Investment Newsletter 20262026-03-11
-
Economics Pain at the Petrol Station Won’t Hurt the Global Economy2026-03-11


Contact Us
Learn why 195,000 clients trust Fisher Investments and its affiliates to manage their money and find out how we may be able to help you achieve your financial goals.
As of 31/12/2025. Includes Fisher Investments and its affiliates.
New to Fisher? Call Us.
Contact Us Today