


Personal Wealth Management / Economics
Q2 US GDP’s Stealthy Strength
US private sector domestic demand growth was the fastest in over three years.

Headline Q2 US gross domestic product (GDP, a government-produced measure of economic output) growth decelerated to 1.5% annualised from Q1’s upwardly revised 2.1%, but that doesn’t tell the story to us.[i] Under the bonnet, we think America’s main economic engines are revving. Although backward looking, last quarter’s stronger-than-appreciated growth shows why the bull market (period of broadly rising equity returns) is on firmer footing than most coverage we follow contends.
As Exhibit 1 shows, headline US GDP (blue bars) indeed slowed from Q1. But almost all of that was due to inventory drawdowns and trade.[ii] Whilst inventory changes are open to interpretation, demand outpacing production likely drove destocking, shaving -0.7 percentage point from GDP growth.[iii] America’s purchasing managers’ indexes (PMIs) hinted at this throughout the quarter. Consider what the Institute for Supply Management noted in June’s manufacturing PMI report: “the Customers’ Inventories Index remained in ‘too low’ territory, contracting at a faster rate. A ‘too low’ status for the Customers’ Inventories Index is usually considered positive for future production.”[iv] It wouldn’t surprise us if restocking soon kicked in as a tailwind. Additionally, imports seemingly subtracted -1.5 percentage points from GDP growth (the same as in Q1), but we think this, too, reflected solid domestic demand (more on this soon).[v]
Exhibit 1: Private Sector Demand Accelerated Under the Hood
Source: FactSet, as of 30/7/2026. Real US GDP and PCE plus gross private fixed investment, Q1 2024 – Q2 2026.
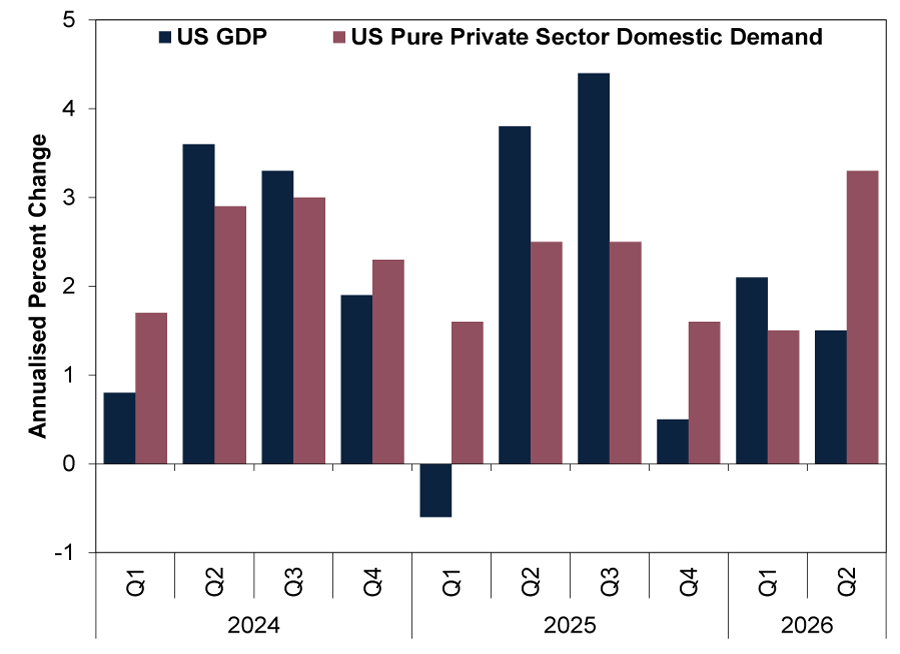
For a better read of underlying economic activity that matters to markets, we prefer looking at GDP’s pure private sector domestic demand components: personal consumption expenditures (PCE, aka consumer spending), business investment and residential investment. As Exhibit 1 also shows, US household and business demand’s 3.3% annualised growth (mauve bars) is the fastest in more than three years (since Q1 2023).[vi] PCE leapt 3.2% from Q1’s 0.5%, led by a 6.8% surge in durable goods spending (think cars, furniture and equipment)—mirroring production.[vii] Meanwhile, businesses continued equipping themselves generously, as capital expenditures (capex) rose another 8.4% annualised on top of Q1’s heady 10.6%.[viii]
Unsurprisingly, information processing equipment kept gaining ground.[ix] Indeed, that is a big reason imports swelled.[x] Though lots of technology hardware may be designed in America, much of it is made offshore.[xi] But that shows you why imports’ seeming subtraction is always net neutral for GDP—those same imports count positively in business investment (and consumer spending).[xii]
Investment wasn’t just about servers and chips kitting out America’s new data centre builds, though. Joining the party—and by far the fastest GDP line items: Industrial equipment grew 29.0% annualised and transportation equipment 29.2%, the latter after three quarters of contraction.[xiii] Now, as that last clause implies, we find growth in these categories tends to be lumpy—don’t extrapolate any trend. Still, strong and broad-based business investment disproves the widespread notion we see that AI is America’s only capex driver. That is also yet another clue that claims AI alone is driving the market are off. The bull market, like US economic growth, is so much broader than commentators we read claim.
Amongst other interesting nuggets, US residential investment also rose 1.5% annualised, its first increase in five quarters.[xiv] This small category isn’t normally a swing factor, but its nascent rebound suggests high existing home prices may finally be starting to spur construction, giving would-be buyers some hope. And as for fears of high petrol prices tanking consumer spending, those fell flat. Fuel buying fell -5.0% annualised in Q2, a -0.1 percentage point subtraction from headline GDP.[xv] This shows how conservation won out, as spending elsewhere continued apace. Last quarter wasn’t a one-off, isolated incident, either. Despite energy prices’ gyrations, their effects usually round to zero. There are only a handful of quarters this century when fuel consumption exceeded plus or minus 0.2 percentage point contributions to GDP growth.[xvi] It is very rarely a major factor. This is a good reminder not to overrate pump prices despite continual reporting and attention we observe.
Instead, focus on the bigger picture: Our research shows households and businesses, overall and on average, remain in fine shape throughout the developed world, helping drive broad corporate earnings growth—much to stocks’ delight. Of course, that isn’t what headlines we peruse usually lead with. Most folks doing ok! may not grab eyeballs, but we find that makes it all the more important for investors to not lose sight of what the economy’s main fundamental drivers truly are.
[i] Source: FactSet, as of 30/70/2026. Real US GDP, Q1 2026 – Q2 2026. Annualised growth is if the quarter-on-quarter growth rate persisted for four quarters.
[ii] Source: FactSet, as of 30/70/2026. Statement based on real US GDP components, Q1 2026 – Q2 2026.
[iii] Source: FactSet, as of 30/7/2026.
[iv] Source: ISM, as of 1/7/2026.
[v] Source: FactSet, as of 30/7/2026. Imports’ contribution to real US GDP growth, Q1 2026 – Q2 2026.
[vi] Source: FactSet, as of 30/7/2026.
[vii] Source: FactSet, as of 30/7/2026.
[viii] Source: FactSet, as of 30/7/2026.
[ix] Source: FactSet, as of 30/70/2026. Statement based on real US GDP components, Q1 2026 – Q2 2026.
[x] “Do Imports Subtract From GDP?” Scott Wolla, The FRED Blog, 13/9/2018.
[xi] “Designed in California but Made ... All Over the World,” John West, News Decoder, 16/6/2025.
[xii] See note x.
[xiii] Source: FactSet, as of 30/7/2026.
[xiv] Source: FactSet, as of 30/7/2026.
[xv] Source: FactSet, as of 30/7/2026.
[xvi] Source: FactSet, as of 30/7/2026. Statement based on gasoline and other energy goods’ contribution to real US GDP growth, Q1 2000 – Q2 2026.
Get a weekly roundup of our market insights.
Sign up for our weekly e-mail newsletter.

You Imagine Your Future. We Help You Get There.
Are you ready to start your journey to a better financial future?

Markets Are Always Changing—What Can You Do About It?
Get tips for enhancing your strategy, advice for buying and selling and see where we think the market is headed next.
Related Resources
-
Market Analysis Escape from CAPE Fear(s)2026-08-21
-
Macro Insights Q2 2026 Global Markets Review & Outlook2026-08-19
-
Market Analysis A Midsummer Check-In on Global Stocks2026-08-18
-
Economics A Rough Reception for UK GDP2026-08-13




Contact Us
Learn why 210,000 clients trust Fisher Investments and its affiliates to manage their money and find out how we may be able to help you achieve your financial goals.
As of 30/06/2026. Includes Fisher Investments and its affiliates.
New to Fisher? Call Us.
Contact Us Today