


Personal Wealth Management / Market Analysis
A Midsummer Check-In on Global Stocks
What we see halfway through Q3.

In and out of the US, our research shows this bull market—prolonged period of overall rising stocks—is bigger than Big Tech. No doubt, as many commentators we follow note, Tech is riding high on the AI wave. But it isn’t the sole driver. Less noticed, we find, under the surface: The rest of the market, globally, is faring fine, too—and in some cases exceeding Tech’s gains. Let us take a tour of global markets to illustrate this very point as Q3 reaches the halfway mark.
First up, look within the US, the world’s AI hotbed. The S&P 500 Energy sector—up 39.7% year to date in pounds—far exceeds Tech’s 23.1%.[i] Tech may be the runner up, but Industrials’ 19.6% year-to-date gain and Materials’ 13.6% also exceed the S&P 500’s 12.9%.[ii] Meanwhile, the worst performing sectors year to date are Tech-adjacent: Consumer Discretionary (-1.0%) and Communication Services (-0.7%).[iii]
Another way to picture the bull market’s broad-based strength: The equal-weighted S&P 500’s 15.1% year-to-date return is outperforming the regular, capitalisation-weighted benchmark—which headlines we read decry as top heavy.[iv] Whilst the S&P 500’s top-10 constituents—all Tech or Tech-like (save one big bank)—make up a hefty 37.5% of the index’s market value and have collectively done well this year, the average S&P 500 company is doing better.[v]
Then too, small-cap stocks are beating large. The Russell 2000, a small-cap index, is up 23.1% year to date, beating the Nasdaq 100—the epitome of Big Tech—which is up 18.4%.[vi]
Next, look outside America. This banger bull market is fully global. The MSCI World Ex. USA Index’s 13.9% year-to-date rise edges out the S&P 500’s 12.9%.[vii] Even the MSCI Emerging Markets Index is outrunning America with its 22.4% year-to-date ascent.[viii]
All told, 13 of 22 non-US developed markets are beating the S&P 500. In alphabetical order they are: Australia (13.7% year to date), Austria (26.5%), Belgium (13.3%), Canada (15.0%), Finland (13.6%), Italy (17.3%), Japan (21.9%), the Netherlands (37.2%), New Zealand (14.5%), Norway (28.6%), Portugal (16.8%), Singapore (25.8%) and Spain (16.4%).[ix]
Sectors within the MSCI World Ex. USA Index are also outperforming. Besides non-US Tech—yes, there is some Tech outside America—which rose 36.6% year to date (outperforming US Tech), Energy (31.9%), Materials (15.3%), Industrials (14.8%) and Financials (20.1%) also outclassed the American benchmark.[x] We think this is a reminder to look globally when hunting investment opportunities.
What is driving such widespread gains globally? A proverbial wall of worry, like every bull market, based on our research. Energy and Norway leading global stocks may not shock—although we think that is mostly old news. Oil prices’ jump earlier this year juiced profits, according to company filings, which we think sent shares skyward. That said, with the apex of oil prices likely behind us, according to our analysis, we think the outlook is less rosy for Energy stocks looking forward. The Netherlands’ topping the developed markets leaderboard isn’t too surprising to us, either. It is a narrow market and home to a global semiconductor equipment juggernaut—amidst a worldwide chip shortage.[xi]
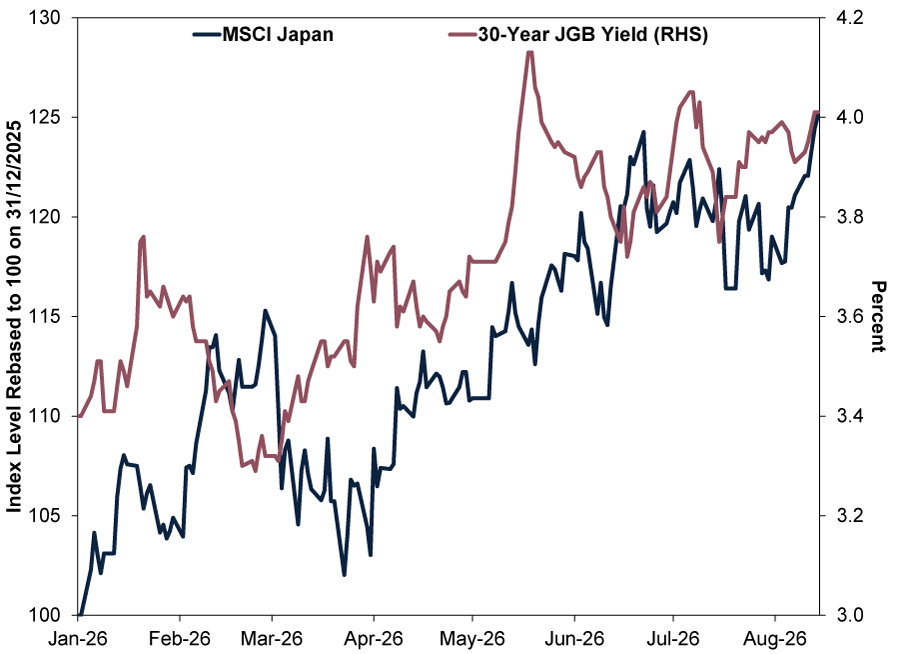
But elsewhere? We think markets are rising as fears prove false. For example, headlines we follow warn continually of trouble erupting from the highest 10-year Japanese government bond (JGB) yields in three decades—and record-high 30-year JGB rates.[xii] But as Exhibit 1 shows, that hasn’t stopped Japanese stocks, nor has the generationally weak yen.[xiii] Meanwhile, global stocks in general are rising (as we described) through a developed market rate ruckus, too.[xiv]
Exhibit 1: Record High Japanese Stocks Despite Rising Rates
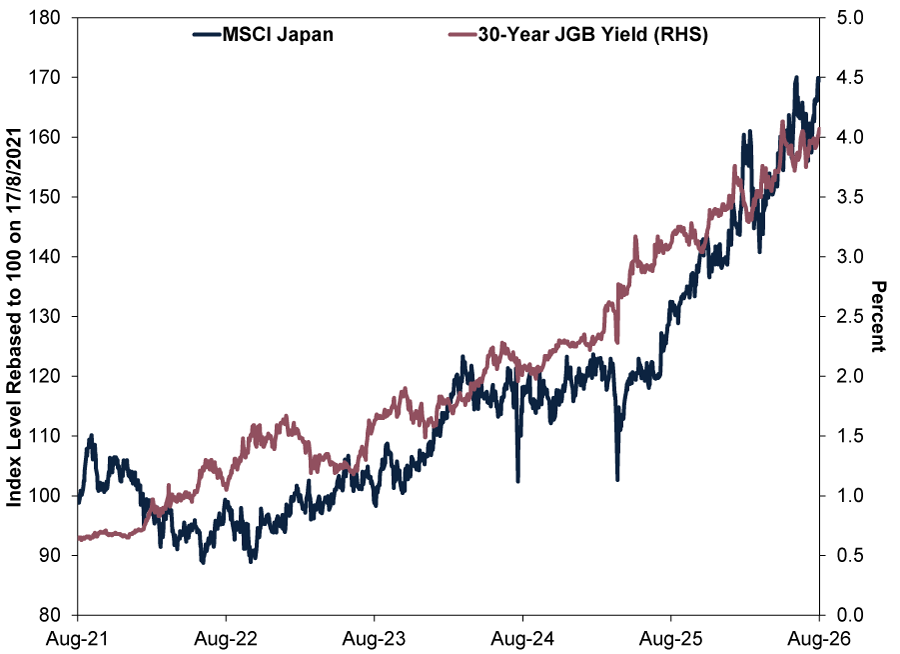
Source: FactSet, as of 17/8/2026. Please see our Annex below for an extended, five-year version of this chart.
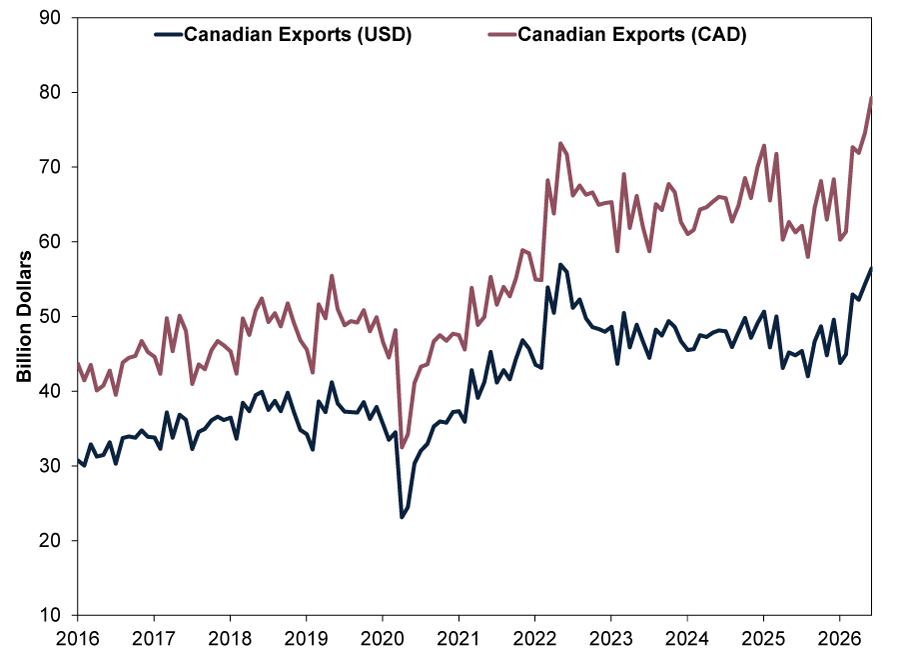
Or take Canada, which many we follow warn faces 50% American tariffs amongst other (false, in our view) scares, like Alberta separatism. Yet Exhibit 2 shows its exports in US dollars approaching record levels—similar to Norway’s—revealing reality better than appreciated as well.[xv] We think that helps underscore Canadian stocks’ outperformance.
Exhibit 2: Record High Canadian Exports Despite Tariffs
Source: FactSet, as of 17/8/2026.
In Australia, many commentators we see warn of market consequences from tightening monetary policy tied to three rate hikes there this year.[xvi] Yet the country’s huge Materials sector and its smaller Energy sector are powering gains.[xvii] But even here, consumer-related stocks are up nicely and Financials are up 10.9%.[xviii] Rate hikes for the wrong reasons aren’t positive to us, but we also don’t think they carry the bite many financial publications we read presume—as we think Australian stocks’ ascent proves otherwise.
So far this year then, we see a bull market stronger and broader than many appreciate. Whilst we see sentiment warming—especially in America—enough worries seemingly linger globally to leave bricks in the wall for this bull market to keep running.
Annex: Japanese Stocks and Long Rates, August 2021 – August 2026
Source: FactSet, as of 17/8/2026.
[i] Source: FactSet, as of 18/8/2026. S&P 500 Energy and Information Technology sector returns with net dividends in GBP, 31/12/2025 – 17/8/2026.
[ii] Source: FactSet, as of 18/8/2026. S&P 500 Index and S&P 500 Industrials and Materials sector returns with net dividends in GBP, 31/12/2025 – 17/8/2026.
[iii] Source: FactSet, as of 18/8/2026. S&P 500 Discretionary and Communication services sector returns with net dividends in GBP, 31/12/2025 – 17/8/2026. Market capitalisation—or cap—is a measure of a company’s size calculated by multiplying its share price and number of shares outstanding. A company’s market-cap weighting in an index is proportionate to this size, whereas an equal-weighted index gives each constituent the same proportion.
[iv] Source: FactSet, as of 18/8/2026. S&P 500 Equal-Weighted Index return with net dividends in GBP, 31/12/2025 – 17/8/2026.
[v] Source: FactSet, as of 18/8/2026. S&P 500 top-10 constituents by market capitalisation, 17/8/2026.
[vi] Source: FactSet, as of 18/8/2026. Russell 2000 and Nasdaq 100 returns with net dividends in GBP, 31/12/2025 – 17/8/2026.
[vii] Source: FactSet, as of 18/8/2026. MSCI World ex. USA Index return with net dividends and S&P 500 return with net dividends in GBP, 31/12/2025 – 17/8/2026.
[viii] Source: FactSet, as of 18/8/2026. MSCI Emerging Markets Index return with net dividends in GBP, 31/12/2025 – 17/8/2026.
[ix] Source: FactSet, as of 18/8/2026. Statement based on MSCI World ex. USA Index constituent country returns with net dividends in GBP, 31/12/2025 – 17/8/2026.
[x] Source: FactSet, as of 18/8/2026. Statement based on MSCI World ex. USA Index sector returns with net dividends in GBP, 31/12/2025 – 17/8/2026.
[xi] Source: FactSet, as of 18/8/2026. Statement based on MSCI Netherlands constituents by market capitalisation, 17/8/2026. “A.I.-Driven Chip Crunch Leads to New Rush of Lobbying in Washington,” Kalley Huang and Ana Swanson, The New York Times, 10/8/2026. Accessed via Democracy Centre for Transparency.
[xii] Source: FactSet, as of 18/8/2026. Statement based on 10-year JGB yields, 3/2/1986 – 17/8/2026, and 30-year JGB yields, 2/9/1999 – 17/8/2026.
[xiii] Source: FactSet, as of 18/8/2026. Statement based on yen per pound, 31/12/2007 – 17/8/2026.
[xiv] Source: FactSet, as of 18/8/2026. Statement based on 10-year government bond rates of the US, UK, Germany, France, Spain, Italy and Japan, 31/12/2025 – 17/8/2026.
[xv] Note: Canada’s exports hit record highs in Canadian dollars in June, whilst Norway’s (in krone and USD) are at pre-pandemic highs—and have yet to exceed 2022’s peak fuelled by European gas shortages in the wake of Russia’s Ukraine invasion. “US and Canada Hold Last-Minute Talks to Stop Trump’s 50% Tariffs,” Paul Wiseman and Rob Gillies, Associated Press, 18/8/2026.
[xvi] Source: Reserve Bank of Australia, as of 18/8/2026.
[xvii] Source: FactSet, as of 18/8/2026. Statement based on MSCI Australia Materials and Energy sector returns with net dividends in GBP, 31/12/2025 – 17/8/2026.
[xviii] Source: FactSet, as of 18/8/2026. MSCI Australia Financials sector return with net dividends in GBP, 31/12/2025 – 17/8/2026.
Get a weekly roundup of our market insights.
Sign up for our weekly e-mail newsletter.

You Imagine Your Future. We Help You Get There.
Are you ready to start your journey to a better financial future?

Markets Are Always Changing—What Can You Do About It?
Get tips for enhancing your strategy, advice for buying and selling and see where we think the market is headed next.
Related Resources
-
Market Analysis The Ineffectual Fed Hike2026-09-21
-
To raise interest rates today is to misunderstand inflation2026-09-17
-
In The News Putting the BoE’s Bond Sale ‘Pause’ In Perspective2026-09-17
-
Market Analysis By the Numbers: A Japanese Growth Check In2026-09-16





Contact Us
Learn why 210,000 clients trust Fisher Investments and its affiliates to manage their money and find out how we may be able to help you achieve your financial goals.
As of 30/06/2026. Includes Fisher Investments and its affiliates.
New to Fisher? Call Us.
Contact Us Today