


Personal Wealth Management / Market Analysis
Summer Data Shine Bright
More evidence of a resilient global economy.

2026 has had seemingly no shortage of financial commentary connecting seemingly bad news to potential trouble in the economy and stock market, from the Iran war to extreme heat in Europe to tariffs and warnings over interest rate spikes. Many analysts we follow warned global economic activity—and, by extension, markets—would suffer. Yet the latest business surveys from major developed economies continue to point positively, as we show here. We think this economic resilience is part and parcel of what global stock markets have been pricing in year to date. To us, the improved data show stocks weren’t detached from a weak economy whilst rising alongside these negative developments, just anticipating a better future.
Let us jump into our TARDIS and go back to earlier in the year, when the Iran war’s outbreak punctuated headlines across the financial realm. The fighting led to higher oil prices—especially after Iran closed the Strait of Hormuz—and war worries seemingly hit investor sentiment hard, knocking global markets.[i]
But stocks followed the three-step pattern our research finds is common when regional conflict erupts in areas with heavy oil and gas exposure. First, volatility picks up in stock markets and oil prices as sabre rattling stokes uncertainty.[ii] Second, the initial fighting sharpens that volatility as markets react in real time and price widespread projections of worst-case scenarios.[iii] Third, stocks rally and oil retreats—usually well before the fighting ends—as investors fathom war is unlikely to spread further and downstream negative economic effects are temporary or not as dire as analysts projected.[iv]
We think this pattern played out in March and April. Some pockets of frothy optimism in US Tech (especially amongst a few AI stocks) notwithstanding, we find the war and popular warnings of its economic implications largely reset sentiment, with many analysts’ projections for Europe and Asia particularly dour due to their perceived vulnerability to the Strait’s blockage. Fast forward several months and the doomsday scenarios haven’t come to pass. Oil prices haven’t climbed in perpetuity to north of $200 per barrel; hot inflation hasn’t reignited, with the small upticks we have seen concentrated in oil and gas-related categories like transport and household energy; economic growth persists.[v] Europe’s severe heatwaves caused tragic wildfires and loss of life (a fact echoed in America, sadly), but business didn’t come to a screeching halt.
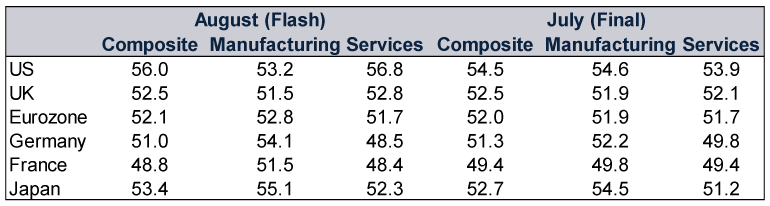
The latest evidence the global economy hasn’t cratered amidst heat, fire and other headwinds? August’s flash purchasing managers’ indexes (PMIs), which are surveys that tally the breadth of growth across the private sector. Readings above 50 indicate more firms reported expansion than contraction (and vice-versa when below 50). Overall, August was a strong month.
Exhibit 1: Latest PMIs for Select Developed Economies
Source: S&P Global, as of 21/8/2026.
America delivered its best composite PMI (which combines services and manufacturing) reading since April 2022.[vi] The UK private sector registered its broadest output since April, whilst Japan saw its highest composite read since February.[vii] Eurozone manufacturing jumped to a 51-month high thanks largely to Germany.[viii] And though German and French composite PMIs hit two-month lows, the broader eurozone composite PMI notched a 9-month high—meaning the other 19 member states more than offset softness in the biggies.[ix]
Most August flash PMIs featured positive responses.[x] Both America and the UK reported improving confidence.[xi] Demand in the eurozone picked up—particularly in manufacturing, thanks to Germany—and Japanese new orders in both manufacturing and services rose.[xii]
But that doesn’t mean all PMIs are chugging along: see Germany’s services and France’s composite.[xiii] In Germany, services respondents blamed the Iran war for another sub-50 reading, the fifth straight.[xiv] Since April, services firms have reported inflationary pressures and geopolitical uncertainty as the primary economic hindrances. However, Germany’s services PMI moved “closer to stabilisation” as August demand improved, perhaps signalling those early-year headwinds are easing.[xv]
France’s weakness has been more chronic, with its composite PMI below 50 for most of the past three years.[xvi] Yet we have often observed the Fifth Republic’s PMIs being an outlier relative to other developed nations. Like their German counterparts, French firms blamed the Iran war and “general economic angst” for lower output this year, but they have also cited volatile domestic politics for weaker output going back to 2024’s snap election.[xvii] We don’t dismiss how France’s slow-burning political crisis could weigh on sentiment to a degree, though we find high-profile events (e.g., volatile politics, extreme weather and/or fighting in a faraway land) are often easy scapegoats. Yet French businesses could also be in a soft patch—which we find aren’t uncommon during global expansions (with one prominent example being Japan during much of the 2010s).[xviii] We see a possibility August’s falling new orders and export business could reflect French businesses’ struggles to meeting customer demand just as much as political or geopolitical uncertainty.
That said, we think PMIs have limitations worth bearing in mind. Again, these business surveys capture only the breadth of growth (or contraction). They don’t reflect magnitude. Because they don’t reveal how much businesses overall grew or shrank, they may not perfectly correlate with output data. This disconnect is apparent with France. Though its composite PMI has been below 50 for most of the past three years, French GDP mostly expanded throughout that period.[xix] The Fifth Republic isn’t alone with this divergence. The UK is another recent example, as its composite PMI showed contraction in May and June—yet monthly GDP grew 0.3% m/m in June after a flat May.[xx]
Still, PMIs can hint at how private sector economic activity is faring (e.g., customer demand, whether or not they face price pressures, etc.). After a long contractionary streak, German manufacturing PMIs crossed above 50 in February and have now delivered six straight expansionary months.[xxi] Echoing that positivity, German industrial production grew on a monthly basis for three straight months through June (after a five-month contractionary streak).[xxii] That is a similar story for America, as manufacturing, a subset of the Federal Reserve’s Industrial Production dataset, grew month over month this whole year through July—in line with an expansionary US manufacturing PMI.[xxiii]
For investment purposes, we think PMIs’ biggest value is their timeliness. They may not show how much private businesses grew (or contracted) by, but we find they provide a quick snapshot of the latest economic conditions, with some detail and commentary from executives that is worth pondering. PMIs quickly confirm a reality stocks have long recognised: We think global growth has been just fine—supportive of future sales and corporate earnings growth that our research finds drive global stocks.
[i] Source: FactSet, as of 26/8/2026. Statement based on MSCI World Index returns in GBP with net dividends and Brent crude oil prices.
[ii] Ibid.
[iii] Ibid.
[iv] Ibid.
[v] Ibid. Statement based on Brent crude oil prices and consumer price inflation measures (including subcategories) in the US, UK, eurozone and Japan. Inflation refers to goods and services prices rising across the broad economy, and consumer price indexes are government statistics attempting to measure this.
[vi] Source: S&P Global, as of 21/8/2026.
[vii] Ibid.
[viii] Ibid.
[ix] Ibid.
[x] Ibid.
[xi] Ibid.
[xii] Ibid.
[xiii] Ibid.
[xiv] Source: S&P Global and FactSet, as of 25/8/2026.
[xv] “German Services Contract in April at Fastest Pace in Over Three Years, PMI Shows,” Staff, Reuters, 5/6/2026. Accessed via Yahoo! Finance.
[xvi] Source: FactSet, as of 26/8/2026.
[xvii] Source: S&P Global, as of 26/8/2026.
[xviii] Source: FactSet, as of 26/8/2026. Statement based on Japan, US, UK and eurozone GDP, industrial production, and retail sales during the 2010s.
[xix] Source: FactSet, as of 21/8/2026.
[xx] Source: Office for National Statistics and FactSet, as of 21/8/2026.
[xxi] Source: FactSet, as of 21/8/2026.
[xxii] Source: FactSet, as of 8/21/2026.
[xxiii] Ibid.
Get a weekly roundup of our market insights.
Sign up for our weekly e-mail newsletter.

You Imagine Your Future. We Help You Get There.
Are you ready to start your journey to a better financial future?

Markets Are Always Changing—What Can You Do About It?
Get tips for enhancing your strategy, advice for buying and selling and see where we think the market is headed next.
Related Resources
-
To raise interest rates today is to misunderstand inflation2026-09-17
-
In The News Putting the BoE’s Bond Sale ‘Pause’ In Perspective2026-09-17
-
Market Analysis By the Numbers: A Japanese Growth Check In2026-09-16
-
Market Analysis On Oil’s Latest Vicissitudes2026-09-16




Contact Us
Learn why 210,000 clients trust Fisher Investments and its affiliates to manage their money and find out how we may be able to help you achieve your financial goals.
As of 30/06/2026. Includes Fisher Investments and its affiliates.
New to Fisher? Call Us.
Contact Us Today