


Personal Wealth Management / Market Analysis
Escape from CAPE Fear(s)
Despite headlines’ fretting, the valuation gauge says nothing about markets’ direction.

For many months, bubble and “lofty valuation” fears have swirled around rising markets. Now another alleged sign is stealing eyeballs: The S&P 500’s cyclically adjusted price-to-earnings (CAPE) ratio is approaching all-time highs set at the apex of the dot-com bubble, which many think shows an almighty crash awaits as an AI bubble implodes. Our counsel? Slow down. While we do see some budding euphoria toward US stocks and think vigilance is important, valuations aren’t helpful in assessing where markets go—and CAPE is even less helpful than most. CAPE is a bizarrely constructed, hugely flawed valuation measure with zero predictive powers.
For context, CAPE (also known as the Shiller P/E, after co-creator Robert Shiller) is a commonly cited market valuation metric that divides the S&P 500’s current price by the prior decade’s average, inflation-adjusted earnings. Its original purpose was to project 10-year forward returns, but many have morphed this, using it to try to time turning points in US equity markets. It doesn’t work, as we will show, but the meme persists.
Today’s worries surround the S&P 500’s CAPE surpassing 40.0 in May before rising to 42.06 today.[i] This, pundits warn, creeps dangerously close to the measure’s 44.19 all-time high in December 1999, roughly three months before the dot-com bubble burst and a bear market began.[ii] Given current AI hype, many connect the dots and presume this means US stocks are “too expensive,” opening the door to a prolonged bloodbath as investors’ expectations become impossible for corporate results to match.
Look, we agree there are some pockets of hot sentiment worth monitoring. But using CAPE as a timing tool is a faulty approach built on a broken indicator. Consider CAPE’s bizarrely adjusting past earnings (the denominator) for inflation but leaving today’s price (its numerator) unadjusted. This suppresses the denominator—especially following periods of hot inflation—artificially lifting CAPE and making stocks appear “more expensive.” It is a bizarre thing to do when you consider both sides of the earnings equation—costs and revenues—are subject to inflation, making nominal profits a sign of whether companies are overcoming price pressures. We think inflation-adjusting them in any context misses the point, especially when there are other, more useful means of scaling.
CAPE also uses a decade of past earnings (versus the more traditional 12-month trailing P/E), aiming to avoid skew from booms or recessions. While that is perhaps a laudable aim, the solution makes the gauge very backward looking, allowing events from years ago to influence today’s CAPE. We think this, in and of itself, adds skew. Consider: Long after the fact, the deep 2008 recession depressed 10-year trailing corporate earnings, exaggerating CAPE. Similarly, today’s CAPE includes 2020’s COVID lockdown-driven downturn (long since over and done with) and the earnings slump that followed hot inflation in late 2022 and early 2023. All that is behind us, way behind us in some cases. Conversely, stocks look forward, pricing in the likeliest factors to influence earnings 3 – 30 months ahead. Earnings from 10 years ago don’t affect today’s.
And while we find other, more standard P/Es can hint at sentiment when they spike or plummet rapidly, CAPE’s extra-backward-looking nature renders it fruitless in that regard. P/Es supposedly signal how much investors are willing to pay for earnings, but we highly doubt investors are incorporating earnings from 2016 when deciding to buy or sell. These data are probably long out of folks’ minds. Moreover, it is odd to cite CAPE as a downturn warning signal considering these calculation quirks are an intentional effort to smooth over cycles. Again, it was never meant to be a tool that forecast peaks and troughs.
Perhaps that is why CAPE has been a poor market cycle predictor. Exhibit 1 helps shows this, charting the S&P’s CAPE at the beginning of each bear market—and each bear market’s cumulative decline—since 1925, when good data begin. For context, CAPE’s median since 1925 is 17.82.[iii]
Exhibit 1: Fluttering CAPE
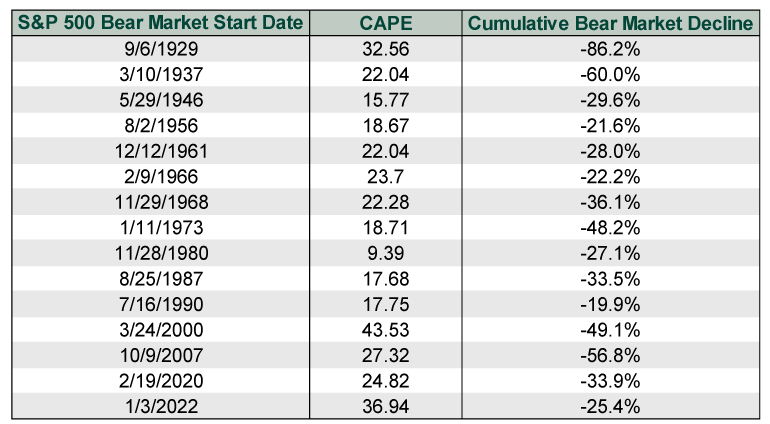
Source: FactSet and Multpl.com, as of 8/18/2026. S&P 500 price return and CAPE, 12/31/1924 – 8/17/2026.
As you can see, no CAPE level clearly or consistently signals a new bear market start or predicts a decline’s magnitude. Bear markets started with below-median CAPE in 1946, 1980, 1987 and 1990. And while the rest began above this mark, CAPE varies widely in these years—ranging from 18.67 – 43.53. There is no magical level that predicts bear markets. As for magnitude, the three highest recorded CAPEs here—March 2000’s 43.53, January 2022’s 36.94, and September 1929’s 32.56—preceded widely varying declines. March 1937’s much milder 22.04, meanwhile, saw stocks drop a whopping -60.0% over the next five years. There is no real connection there.
CAPE fears (sorry) in the 2010s provide further color. CAPE floated around its 1929 peak throughout much of the decade, eventually exceeding it in early 2018.[iv] This was a huge source of worry among pundits, though it was an excellent decade for stocks. While 2018 was tough, valuations were coincident to stocks’ performance. The majority of that year’s slump started in late September and reached its apex in December, when numerous hedge funds were forced to fire-sell assets to meet redemption requests and planned closures. CAPE had nothing to do with forced selling, which resulted from years of poor fund performance.
Ditto 2020’s bear market, which had everything to do with COVID lockdowns and nothing to do with hot sentiment or stocks being “too expensive.” While sentiment was hot heading into 2022’s shallow bear market, with pockets of euphoria in Special Purpose Acquisition Companies (SPACs) and other niche corners, you wouldn’t see those in the S&P 500’s CAPE. There are other, better sentiment gauges that catch true euphoria.
Reacting to CAPE at the wrong time can have consequences. Rewind to a famous example: December 5, 1996, when then-Fed chair Alan Greenspan famously questioned if investors’ “irrational exuberance” had “unduly escalated asset values.”[v] Just two days prior, Shiller briefed Greenspan on CAPE’s rise, so it stands to reason the Fed chair had it in mind.[vi] Yet that bull market continued for more than three years, with US stocks more than doubling.[vii] Investors who sold on Greenspan’s warning would have missed out on huge gains, potentially straying them from their goals and objectives.
This bull market will eventually end, as all do. And yes, we do think currently elevated sentiment shows we are in this bull market’s latter stages. Yet those latter stages can last longer than you think—and CAPE won’t help you navigate that.
[i] Source: Multpl.com, as of 8/18/2026.
[ii] Source: FactSet, as of 8/18/2026. S&P 500 total return, 12/31/1999 – 12/31/2002.
[iii] Source: Multpl.com, as of 8/18/2026.
[iv] Ibid.
[v] “Remarks by Chairman Alan Greenspan,” Federal Reserve, 12/5/1996.
[vi] “Irrational Exuberance,” Robert J. Shiller, Princeton Press, 2000.
[vii] Source: FactSet, as of 8/18/2026. S&P 500 total return, 12/5/1996 – 3/24/2000.
If you would like to contact the editors responsible for this article, please message MarketMinder directly.
*The content contained in this article represents only the opinions and viewpoints of the Fisher Investments editorial staff.
Get a weekly roundup of our market insights
Sign up for our weekly e-mail newsletter.

You Imagine Your Future. We Help You Get There.
Are you ready to start your journey to a better financial future?
Where Might the Market Go Next?
Confidently tackle the market’s ups and downs with independent research and analysis that tells you where we think stocks are headed—and why.
Related Resources
-
Expert Commentary This Week in Review | AI Debt, French Bond Yields, Oil Prices
 2026-10-23
 -
Behavioral Finance The Risk in Seeking ‘Safety’2026-10-22
-
In The News October ScamWatch2026-10-21
-
Market Analysis A Mid-October US Economic Scorecard2026-10-20




Learn More
Learn why 210,000 clients trust us to manage their money and how Fisher Investments and its affiliates may be able to help you achieve your financial goals.
As of 9/30/2026
New to Fisher? Call Us.
Contact Us Today