Personal Wealth Management / Economics
Levels vs. Rates: Navigating Pandemic-Skewed Data
How to look through lockdown skew—and approach economic data generally.

Last week, economic data releases showed April UK car registrations spiked 3,176.6% y/y—bullish![i] The country’s inflation rate “more than doubled” to 1.5% y/y—perhaps not so bullish.[ii] Meanwhile, Japanese exports leapt 38.0% y/y, the “most in a decade,” while Taiwan’s export orders “surged” 42.6%.[iii] Then again, on the not so great side, Chinese industrial production growth dwindled to 9.8% y/y from March’s 14.1% (and from over 35% in January – February).[iv] Of course, lockdowns shuttering activity late last spring (early Q1 in China) heavily skewed year-over-year growth figures, driving the eye-popping results. So how can investors get a better sense of where the economy is today? Instead of focusing on skewed rates of change, look at economic series’ actual levels.
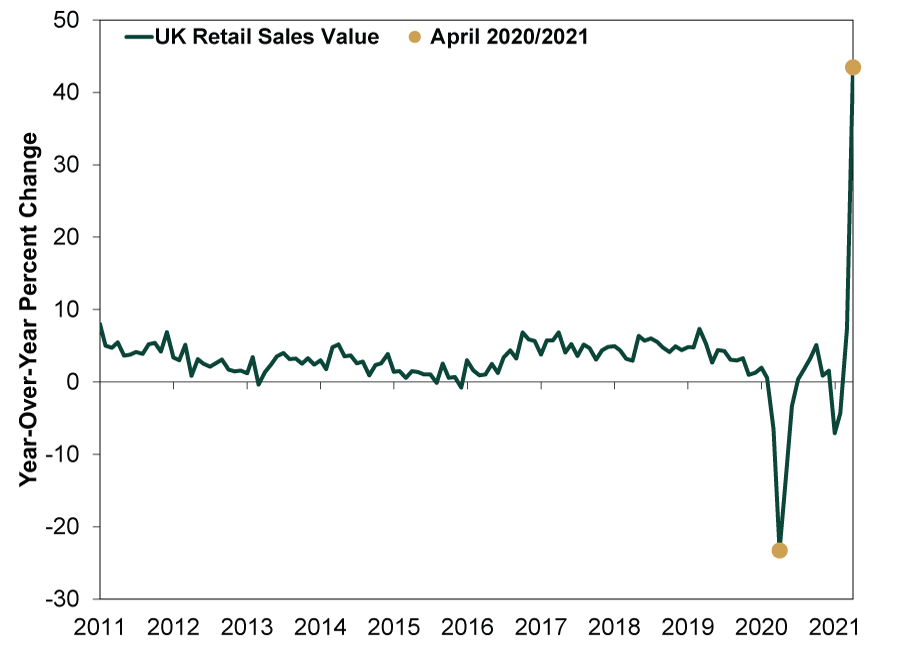
Headlines typically focus on rates of change. Take last Friday’s April UK retail sales report for example. In value-spent terms, UK retail sales “soared” 43.5% y/y, accelerating from 7.3% in March.[v] (Exhibit 1) That figure grabs attention, but a growth rate far above anything in recent history is out of context—it lacks needed perspective for investors. In this case, it mostly speaks to the low base a year ago—a shutdown-and-reopening-skewed look backward. It tells you zero—zippo, nada, nothing—about where the economy is going. For investors in forward-looking markets, that is what counts.
Exhibit 1: Record Year-Over-Year Growth Isn’t Quite What It Seems
Source: FactSet, as of 5/21/2021. UK retail sales value, January 2011 – April 2021.
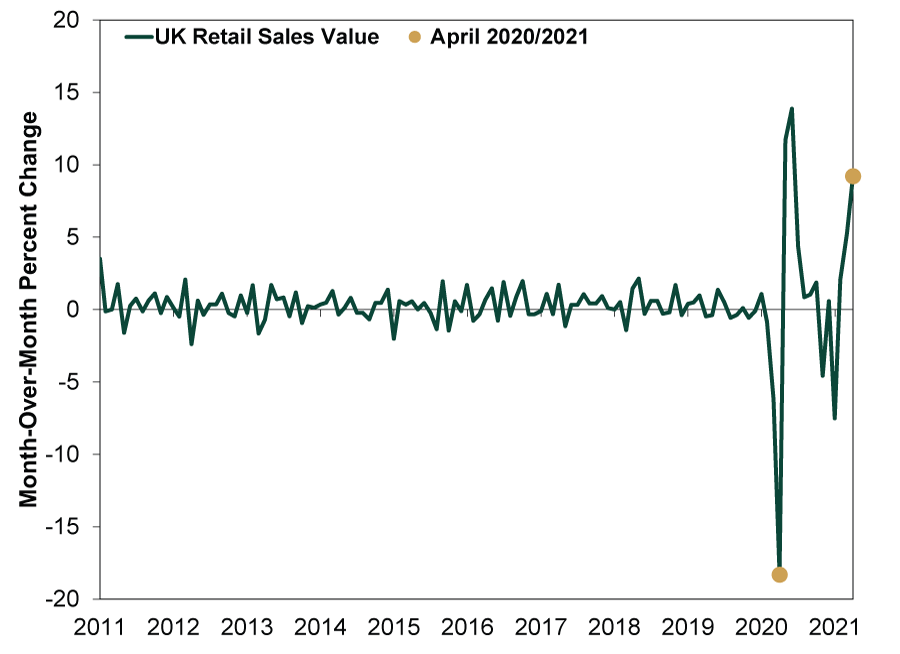
Now, many articles see this and focus instead on month-to-month changes relative to their recent trends. But as Exhibit 2 shows, those have been all over the place, too. Does April’s 9.2% m/m bounce, which rivaled May and June 2020’s reopening rebounds, tell you anything about where the economy is heading?
Exhibit 2: Neither Is Gangbusters Monthly Growth
Source: FactSet, as of 5/21/2021. UK retail sales value, January 2011 – April 2021.
Given the extremity of the lockdowns’ impact on data, the rate of change is too skewed to yield great insights. That is true for some series even during non-COVID times. One prominent example is the US’s durable goods orders report, which often displays huge month-over-month swings any time there is a major airshow. That creates a gigantic one-off boom in aircraft orders in the month, setting up a big drop the next, when there is no airshow—which bleeds through to the headline figures in a big way. Observing a one-off record jump isn’t too helpful without understanding the trend and where the gauge is exactly.
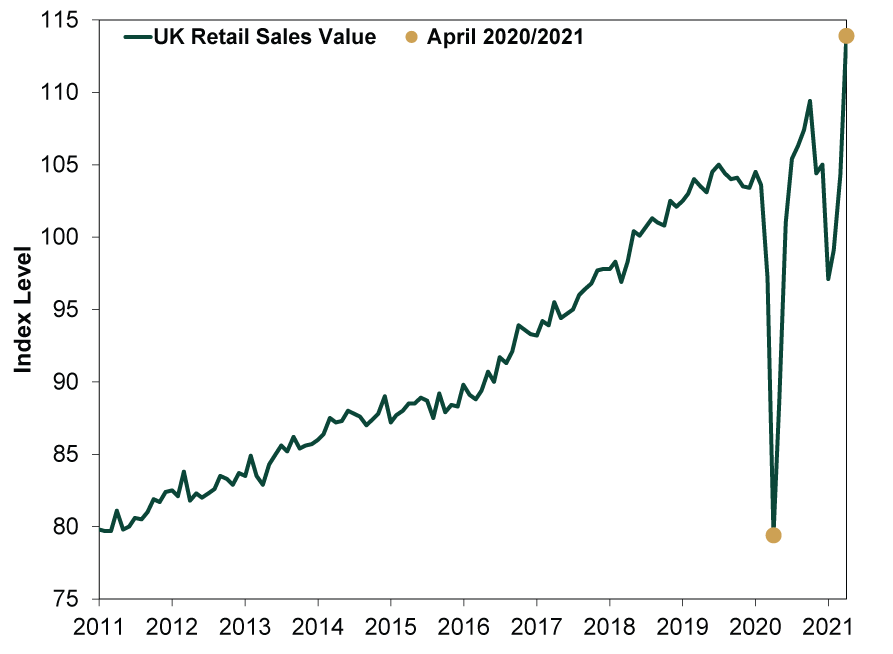
To see the actual trend, look to the actual levels. (Exhibit 3) UK retail sales fell off a cliff last April, more than recovered through 2020’s summer and fall, then dipped again during the winter’s second lockdown. But now, sales are hitting new highs again.
Exhibit 3: Levels Give a Better Picture of What Happened
Source: FactSet, as of 5/21/2021. UK retail sales value, January 2011 – April 2021.
While nice, keep in mind retail sales are just a small slice of the UK economy—a narrow snapshot of shopping activity last month. One that has also been greatly boosted by digital commerce, allowing storefronts to bypass lockdown restrictions. But that is starting to even out, according to official data and private surveys, suggesting a return to normal (and less blistering growth rates).[vi]
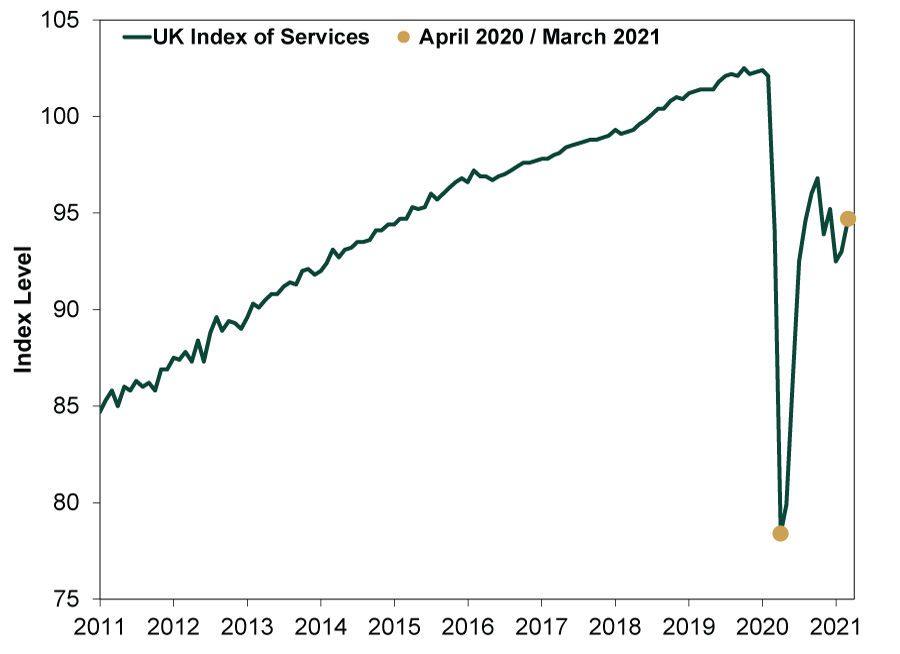
For a broader view though, consider services—about 80% of UK GDP. (Exhibit 4) Next month, the Index of Services is likely to soar on a year-over-year basis, but it is mostly due to statistical noise. In March 2021, the latest data available, it registered 94.7—just 0.6% above March 2020’s 94.1.[vii] But last April, amid lockdowns, it tumbled to 78.4. If there is no change from last month’s reading, the Index will “soar” a huge 20.8% y/y. But looking at levels strips out that noise. It lets you see that UK services are -7.2% below their February 2020 pre-pandemic level—well above the -23.2% nadir at April 2020’s depths, but in a hole nonetheless. Don’t let volatile rates of change lead you to wrong conclusions.
Exhibit 4: Note the Bigger Picture, Too
Source: FactSet, as of 5/21/2021. UK Index of Services, January 2011 – March 2021.
So, where do you find these oft-neglected levels when coverage isn’t forthcoming? Governments’ statistical agencies are the go-to source. In the UK, most economic data are readily available through the Office of National Statistics. For EU and eurozone data, try Eurostat. In America, the St. Louis Fed’s database aggregates a useful array of data from the various statistical groups that compile them. Also, Fisher Investments offers a few links to specific series that you can adjust as you like on our website.
That said, what matters for markets going forward are big deviations from what they currently expect—not what is already publicly disseminated and priced in. Economic data—no matter how you slice and dice them—are limited in that regard. They are inherently backward looking. But if you see reports hyping big rates of change, check where the level is. It can give you insight into just how meaningful those huge rises or falls are.
[i] “Europe New-Car Registrations Soar 256% From Pandemic Low Point,” William Wilkes, Bloomberg, 5/18/2021.
[ii] “UK Inflation Rate More Than Doubles in April,” Staff, BBC, 5/19/2021.
[iii] “Japan’s Exports Jump Most in Decade as Trade Recovery Perks Up,” Tetsushi Kajimoto and Daniel Leussink, Reuters, 5/20/2021. “Taiwan’s Export Orders Surge for 14th Straight Month,” Ching-Tse Cheng, Taiwan News, 5/21/2021.
[iv] “China Industrial Output, Fixed Asset Investment Growth Moderates,” Staff, RTTNews, 5/16/2021.
[v] “UK Retail Spending Soars as Economy Reopens,” David Milliken and Andy Bruce, Reuters, 5/21/2021.
[vi] “UK Shoppers Return to Supermarkets as Online Spending Slows,” Sarah Butler, The Guardian, 5/25/2021.
[vii] Source: FactSet, as of 5/25/2021.
If you would like to contact the editors responsible for this article, please message MarketMinder directly.
*The content contained in this article represents only the opinions and viewpoints of the Fisher Investments editorial staff.
Get a weekly roundup of our market insights
Sign up for our weekly e-mail newsletter.

You Imagine Your Future. We Help You Get There.
Are you ready to start your journey to a better financial future?

Where Might the Market Go Next?
Confidently tackle the market’s ups and downs with independent research and analysis that tells you where we think stocks are headed—and why.
Related Resources
-
Expert Commentary Why Ken Fisher Is Optimistic About European Stocks
 2026-07-23
 -
Economics A Summertime Check-in on US Consumers2026-07-23
-
Market Analysis Why the SOX “Bear Market” Isn’t Foreboding2026-07-21
-
Politics Blunting Burnham?2026-07-21


Learn More
Learn why 210,000 clients trust us to manage their money and how Fisher Investments and its affiliates may be able to help you achieve your financial goals.
As of 6/30/2026
New to Fisher? Call Us.
Contact Us Today