Personal Wealth Management / Market Analysis
More on the 5-Year Minus 2-Year Spread's Inversion
No yield curve inversion is an automatic sell signal. But that is doubly true for incorrectly constructed ones.

Tuesday, we shared our perspective on the inversion of the 5-year minus 2-year US Treasury yield curve—an article that seems to have struck a chord with readers, generating a good deal of reaction and follow-up questions. Most seemingly agree: The selection of two points in the yield curve’s middle doesn’t amount to inversion of a meaningful spread. However, several readers pose the question: Isn’t this an early warning sign of inversion to come in more-telling spreads, like the 10-year minus 3-month or 10-year minus effective fed-funds rate? In our view, it may be. But that isn’t helpful for investors. You don’t need an early warning sign of an inverted 10-year minus 3-month curve. It is an—imperfect—early warning sign.
Without retreading too much ground we covered Tuesday, yield curve inversion—short-term rates topping long-term rates—does matter. A lot. Banks borrow short term to fund long-term loans, so yield curve spreads heavily influence loan profitability. The reason the 5-year minus 2-year spread is suboptimal, in our view, is the maturities don’t approximate banks’ funding costs. Nor is five years exactly what we would call a long-term loan. More meaningful curves like the 10-year minus effective fed-funds rate or the 10-year minus 3-month aren’t inverted presently.
But is the 5-year minus 2-year spread hinting inversion of the 10-year minus 3-month looms? Perhaps. Historically, inversion of the 5-year minus 2-year spread has preceded most inversions of the 10-year minus effective fed-funds rate or the 10-year minus 3-month. But the thing is, this isn’t useful information for an investor sizing up the equity market.
Even the more meaningful spreads frequently invert in latter-stage bull markets—often well before bull market peaks. We covered this in an August post, sharing the table below to illustrate this point: Yield-curve inversion is not a timing tool. Full stop.
Exhibit 1: It Is Often a Long Way to the Top After Initial Yield Curve Inversion
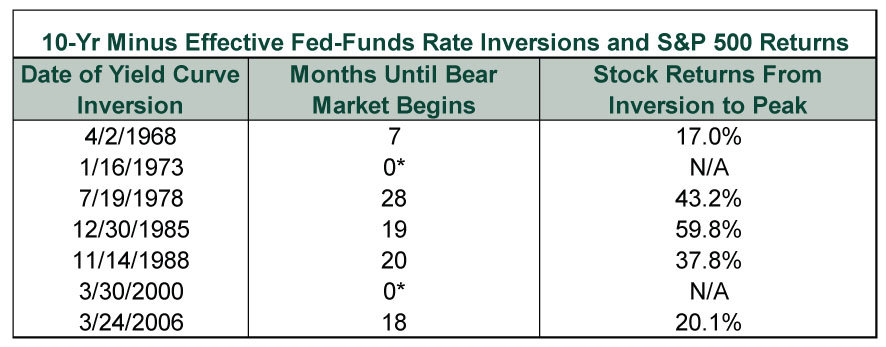
Source: Federal Reserve Bank of St. Louis and Global Financial Data, Inc., as of 7/21/2018. *Inversion occurred after the bull market’s peak.
The same holds for 10-year minus 3-month inversions. Hence, inversion of even meaningful yield curves isn’t an automatic sell signal. Much less yield curves that (imperfectly) hint at inversion of other yield curves! Treating the 5-year minus 2-year spread—or the 5-minus-3, 10-minus-5 or 10-minus-2, for that matter—as a sell signal runs the risk of being way too early.
If you would like to contact the editors responsible for this article, please message MarketMinder directly.
*The content contained in this article represents only the opinions and viewpoints of the Fisher Investments editorial staff.
Get a weekly roundup of our market insights
Sign up for our weekly e-mail newsletter.

You Imagine Your Future. We Help You Get There.
Are you ready to start your journey to a better financial future?

Where Might the Market Go Next?
Confidently tackle the market’s ups and downs with independent research and analysis that tells you where we think stocks are headed—and why.
Related Resources
-
Politics Blunting Burnham?2026-07-21
-
Market Analysis Why the SOX “Bear Market” Isn’t Foreboding2026-07-21
-
Expert Commentary 3 Things You Need to Know This Week | Q2 Earnings, ECB Meeting, Trump Accounts
 2026-07-20
 -
Weekly Wrap-Up Fisher Investments Reviews: Last Week in Markets—July 13 - July 172026-07-20


Learn More
Learn why 210,000 clients trust us to manage their money and how Fisher Investments and its affiliates may be able to help you achieve your financial goals.
As of 6/30/2026
New to Fisher? Call Us.
Contact Us Today