Personal Wealth Management / Market Analysis
People Are Confused About the Yield Curve
The important yield curves did not invert this week.

Public Service Announcement: The yield curve—the difference in rates between various maturities from the same bond issuer—did not invert on Tuesday morning. Yes, some financial media outlets say it did. But they reported on the wrong yield curve. It was the 5-year minus 2-year curve that inverted on Tuesday, following the 5-year minus 3-year’s inversion on Monday. Near as we can tell, these are arbitrary spreads—probably not worth a pixel if global stocks weren’t in a correction and volatility weren’t plaguing us all. The hoopla—and accompanying warnings that this is a recession signal—seem like trying to pin a cause on volatility. In our view, nothing happening in Treasury markets today signals a recession or bear market is likely.
We appreciate media being laser focused on the yield curve, in theory. After all, it is one of the most telling leading indicators in the developed world. But once you understand why the yield curve works, it becomes apparent that the 5-year minus 2-year, 5-year minus 3-year and 10-year minus 2-year curves aren’t very relevant. The yield curve matters because it represents banks’ business models and potential profits—important because profits drive bank lending, which drives money supply growth, which generally drives economic growth. If lending isn’t profitable, banks largely won’t do it.
The yield curve represents profits because banks borrow at short-term interest rates and lend at long-term rates. So short rates are their borrowing costs, long rates are their loan revenues, and long rates minus short rates are their potential profits. An inverted yield curve means long rates are below short rates, making lending a losing proposition. That causes credit markets to freeze, and if the freeze lasts for a meaningful length of time, recession usually follows. Not immediately, as it takes a while for trouble in credit markets to show up in economic data, but eventually.
To see why these newfangled yield curves aren’t much good, consider how banks typically operate. We aren’t aware of any banks that fund themselves solely with 2- or 3-year CDs. Usually, banks get most of their funds from checking and savings accounts or interbank loans—so the overnight and 3-month interest rates are the most relevant cost measures. Similarly, few banks hang their hat on making 5-year loans. Most new loans are much longer-term—think mortgages and long-term business loans. To us, using 10-year rates as a benchmark is a reasonable average. So, in our view, this makes the 10-year minus fed funds and 10-year minus 3-month yield curves the most relevant.
As Exhibits 1 – 5 show, these also happen to be the most telling yield curves. The yield curve spreads making headlines now usually invert a couple years before a bear market begins. Which makes sense, because their inversions have no logical reason to make credit markets seize. Plus, as a general rule, the shorter the difference between the two bond maturities, the narrower the spread will be, so it isn’t shocking that the 5-year minus 3-year would invert first, followed by the 5-year minus 2-year. Our preferred yield curves invert much closer to the bear’s beginning, which also makes sense, because their inversions are directly responsible for the seizing credit markets that eventually bring recession.
Exhibit 1: 5-Year Minus 2-Year Yield Curve Spread
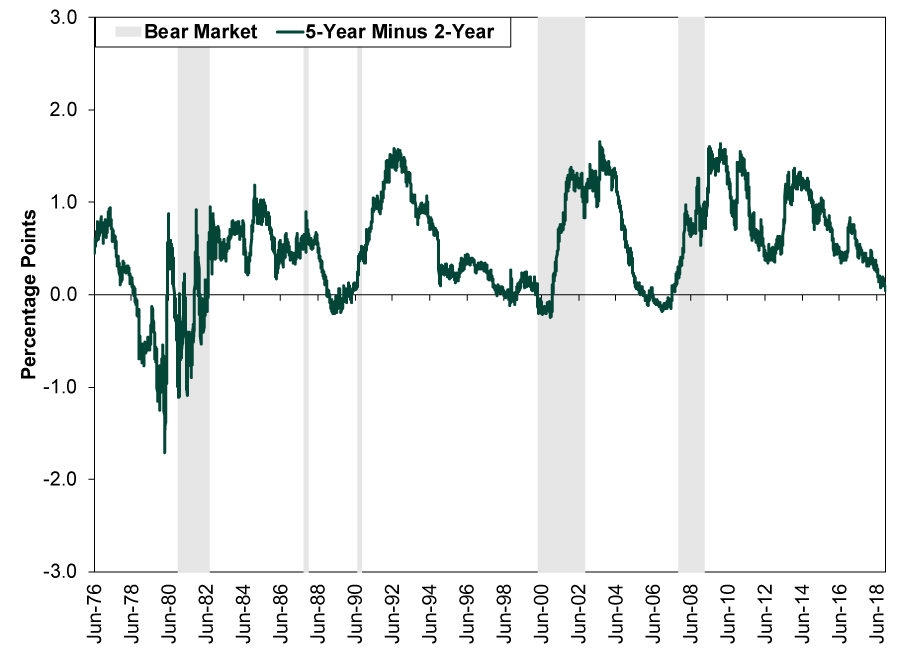
Source: St. Louis Fed, as of 12/4/2018. 5-year and 2-year constant maturity US Treasury yields, 6/1/1976 – 11/30/2018. Shading represents S&P 500 bear markets.
Exhibit 2: 5-Year Minus 3-Year Yield Curve Spread
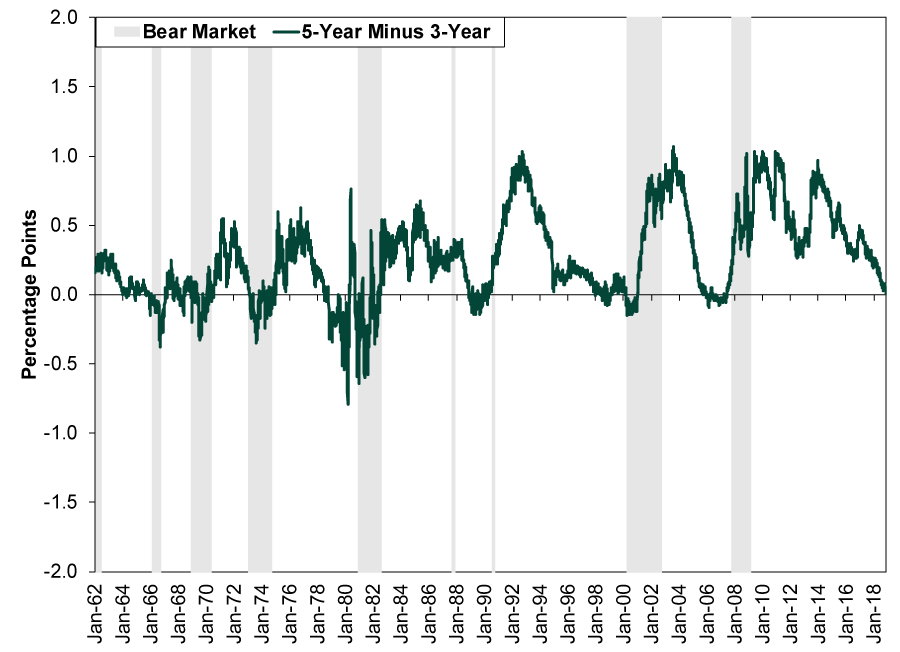
Source: St. Louis Fed, as of 12/4/2018. 5-year and 3-year constant maturity US Treasury yields, 1/1/1962 – 11/30/2018. Shading represents S&P 500 bear markets.
Exhibit 3: 10-Year Minus 2-Year Yield Curve Spread

Source: St. Louis Fed, as of 12/4/2018. 10-year and 2-year constant maturity US Treasury yields, 6/1/1976 – 11/30/2018. Shading represents S&P 500 bear markets.
Exhibit 4: 10-Year Minus 3-Month Yield Curve Spread
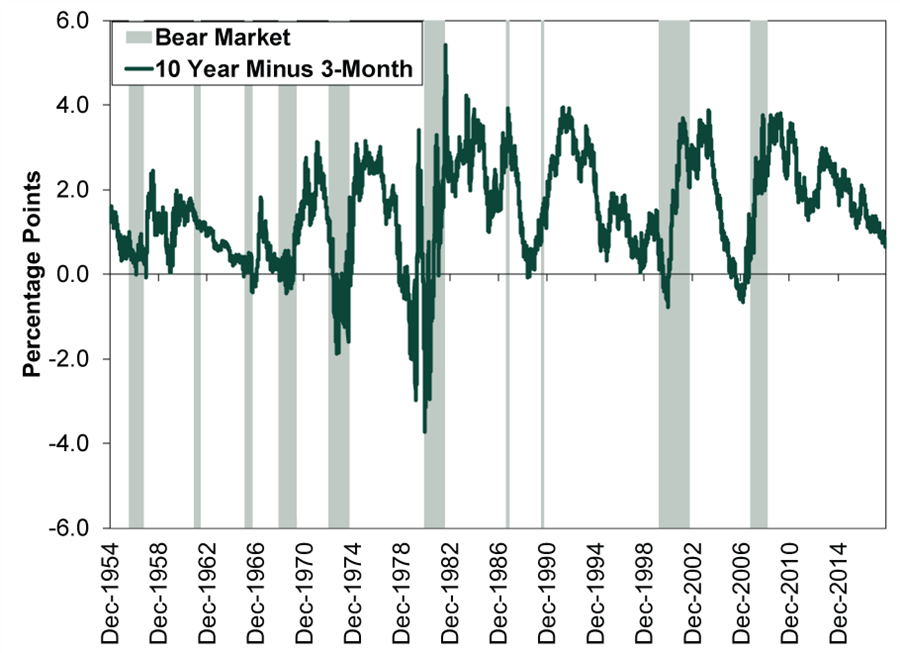
Source: St. Louis Fed, as of 12/4/2018. 10-year and 3-month constant maturity US Treasury yields, 12/31/1954 – 12/3/2018. Shading represents S&P 500 bear markets.
Exhibit 5: 10-Year Minus Fed-Funds Yield Curve Spread
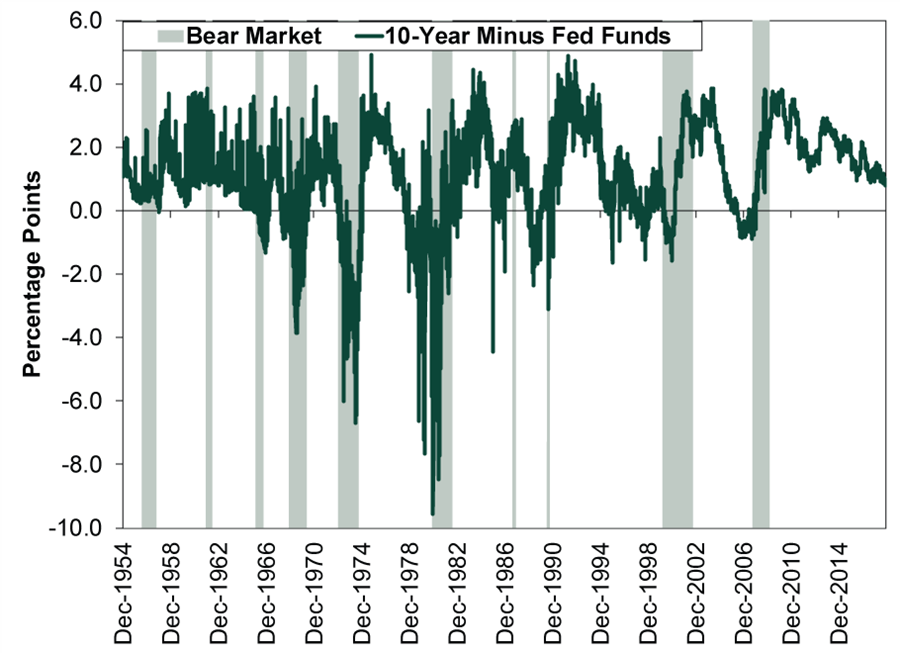
Source: St. Louis Fed, as of 12/4/2018. 10-year constant maturity US Treasury yield and effective fed-funds rate, 12/31/1954 – 12/3/2018. Shading represents S&P 500 bear markets.
While we are at it, there is one other yield curve-related misperception we feel compelled to set straight. We have seen many pieces arguing the yield curve isn’t a telling signal anymore because of all the Fed’s monkeying with long-term interest rates. They claim inversion would happen solely because the Fed is still reinvesting some of its long-term bond holdings (a relic of quantitative easing). If the yield curve inverts because the Fed keeps rates artificially low, rather than because brewing economic problems are bringing down long rates, they conclude it is meaningless. The trouble here is that it interprets the yield curve as a symptom of problems, rather than a cause. That ignores the yield curve’s influence on bank lending, not to mention over a century’s worth of economic theory and data. If you hear a rumbling sound, it is probably Milton Friedman rolling over in his grave and yelling about the Quantity Theory of Money.
We point this out because if this mentality sticks, then we could eventually reach a place where the yield curve inverts and the investing world largely writes it off as meaningless. In our view, that would be a sign of complacency or euphoria—a good reason to think long and hard about the risk of a bear market forming. That isn’t today, in our view, as the proper yield curves are still adequately positive and sentiment seems roiled by insignificant ones flipping negative. But keep an eye out and an ear to the ground.If you would like to contact the editors responsible for this article, please message MarketMinder directly.
*The content contained in this article represents only the opinions and viewpoints of the Fisher Investments editorial staff.
Get a weekly roundup of our market insights
Sign up for our weekly e-mail newsletter.

You Imagine Your Future. We Help You Get There.
Are you ready to start your journey to a better financial future?

Where Might the Market Go Next?
Confidently tackle the market’s ups and downs with independent research and analysis that tells you where we think stocks are headed—and why.
Related Resources
-
Market Analysis Pumping Up the Yen?2026-07-17
-
Expert Commentary This Week in Review | US-Iran Conflict, US Inflation, New UK Prime Minister
 2026-07-17
 -
Market Analysis Business Friendly Bureaucracy or No, Britain is Growing2026-07-16
-
Economics Don’t Doubt the Old World2026-07-16


Learn More
Learn why 210,000 clients trust us to manage their money and how Fisher Investments and its affiliates may be able to help you achieve your financial goals.
As of 6/30/2026
New to Fisher? Call Us.
Contact Us Today