


Personal Wealth Management / Market Analysis
Putting Negative Equity Risk Premiums in Proper Perspective
Cut through the math and jargon and you see a valuation metric that isn’t any more telling than others.

Concerns over the bull market’s viability are commonplace these days. Some are simple, as people can’t fathom how stocks will keep rising when so much news is so negative. But lately, other, fancier reasons to be bearish have cropped up. Specifically, a measure called the equity risk premium (ERP) has crept back into headlines by flirting with a negative reading, which some say means stocks no longer offer high enough returns to make the risk worthwhile. Charts showing prior dips below zero during the 2000 – 2002 bear market allegedly prove the point. Yet dig in, and you will find it doesn’t withstand scrutiny. Come along and see, and we promise to make the math and jargon as painless as possible.
The ERP refers to the gap between stocks’ earnings yield and the 10-year US Treasury yield. The latter is widely considered the “risk-free interest rate,” which glosses over plenty of risks but is basically the industry’s benchmark.[i] Stocks’ earnings yield is the inverse of the price-to-earnings ratio. So if the S&P 500’s P/E ratio were 20, its earnings yield would be 5%. The Wall Street Journal defines this as “the profit companies generate relative to stock valuations.”[ii] A lot of folks use it as a projected return. We don’t think that is quite right, which we will get to. But with projected returns in mind, some analysts like to subtract Treasury yields from earnings yields. If the gap is nicely positive, it allegedly means stocks pay handsomely, rewarding the added risk. If it is negative, it supposedly implies stocks are, effectively, overvalued.
Whew. You survived the math. Take a deep breath. Look out the window. Watch the pretty bird out there for a sec. Good now? On we go.
First, we will consider the S&P 500’s forward P/E ratio—one in which the “E” is based on consensus analyst estimates of the next 12 months’ profits. Here the ERP is barely positive today. Its last meaningful trip below zero was indeed during the dot-com bust. Hence, today’s warnings that bad times could loom.
However, the full history guts this. Exhibit 1 takes the forward ERP back to 1995, when data begin. As you will see, that negative stretch didn’t start when the bear market began. It actually started in January 1997, with a brief blip positive as the Fed cut rates to ease Y2K fears.
Exhibit 1: A Longer Look at the S&P 500’s Forward ERP
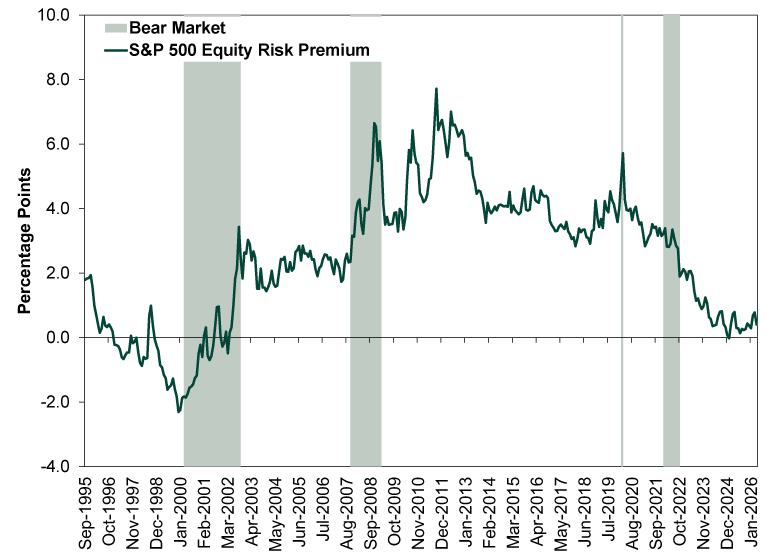
Source: FactSet, as of 5/27/2026. S&P 500 forward earnings yield and 10-year US Treasury yield (constant maturity), monthly, September 1995 – April 2026.
1997, 1998 and 1999 were fantastic times to own stocks. The ERP actually hit its low at yearend 1999, three months before the dot-com bear market began. Nothing here is a timing tool. Nor would the ERP have helped much with timing the bear market’s end, considering it flipped positive about half a year before the market’s low.
Consider, too, when the ERP was especially high: during the 2007 – 2009 global financial crisis. That was an absolutely wretched stretch for stocks, with the S&P 500 losing over half its value. But that market decline meant forward P/E ratios fell, which raises the earnings yield. Meanwhile, with the Fed cutting rates to zero, 10-year Treasury yields hit then-generational lows. Long-term US Treasurys notched double-digit positive total returns during stocks’ bear market. The ERP painted a false picture, one at odds with real-world returns.
While the forward P/E dataset isn’t huge, trailing P/Es (using reported earnings over the past 12 months) go back further, letting us take a longer look. We do so in Exhibit 2, which stretches back to January 1962, when consistent 10-year yield data begin. At first blush, this one may look more useful, since it actually turned negative in 2008. But it quickly falls apart, too, with its ups and downs failing to align with market cycles.
Exhibit 2: An Even Longer Look at the S&P 500’s Trailing ERP
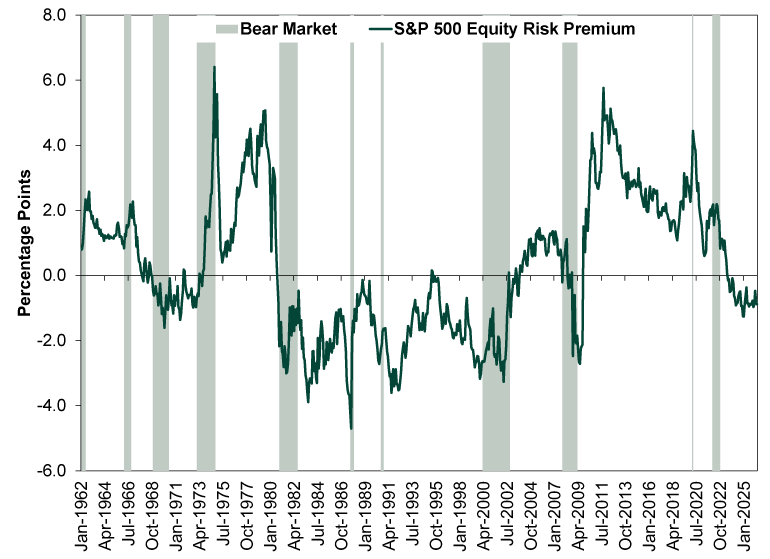
Source: Finaeon, Inc. and FactSet, as of 5/27/2026. S&P 500 trailing earnings yield and 10-year US Treasury yield (constant maturity), monthly, January 1962 – April 2026.
Notice how it is negative for almost the entirety of the 1980s and 1990s? We don’t recall that being a 20-year bear market. We do recall bear markets in 1980 – 1982, 1987 and 1990, with lovely bull markets in between. A consistently negative ERP doesn’t help time any of this. The 1960s’ and 1970s’ ups and downs don’t match actual market cycles, either. Nothing in this history tells you the ERP can predict stock returns. Mostly, we think it just signals long-term bond yields are back to normal after their abnormally low early 21st century.
Nor should the ERP predict returns, which is where our take on the earnings yield comes in. We think of it as the return you would get forever, not including dividends, if earnings never changed. But earnings always change and stocks do pay dividends, so it isn’t a real-world projection from a personal finance or individual investing standpoint. Instead, it is a handy back-of-the-envelope calculation CFOs can use to gauge whether a debt-funded stock buyback makes sense. In this scenario, if the ERP is nicely positive, it is basically free money for the company. A simple arbitrage play. If it is negative, borrowing to fund buybacks is less wise. (If you find this interesting and would like to learn more, we humbly suggest checking out the third edition of Ken Fisher’s The Only Three Questions That Count, which has a fresh discussion.)
Knowing this can help investors set expectations about future buybacks. But even that isn’t so meaningful to returns. We do think buybacks are inherently bullish since they reduce stock supply, and stocks move on supply and demand. But they are only one supply input, along with IPOs, secondary offerings, mergers and stock-based employee compensation. They are also widely watched, so they get priced in instantly. So to us, it is more useful to watch sentiment surrounding buybacks to spot signs of excess optimism or pessimism. Today, the buyback conversation is pretty quiet.
So overall, we view the nascent ERP fears as false, a freshly mortared brick in this bull market’s wall of worry. Perhaps at some point the ERP will be negative and everyone will laugh it off. Maybe then it will be time to take a close look. But for now, sentiment here looks too dreary.
[i] Risk-free in this context refers to Treasurys’ near-zero risk of not repaying interest and principal. But bonds are still subject to the risk of temporary declines when interest rates rise, inflation risk and more.
[ii] “The Risk Premium for Holding Stocks Over Bonds Is Vanishing,” Hannah Erin Lang and Sam Goldfarb, The Wall Street Journal, 5/25/2026.
If you would like to contact the editors responsible for this article, please message MarketMinder directly.
*The content contained in this article represents only the opinions and viewpoints of the Fisher Investments editorial staff.
Get a weekly roundup of our market insights
Sign up for our weekly e-mail newsletter.

You Imagine Your Future. We Help You Get There.
Are you ready to start your journey to a better financial future?
Where Might the Market Go Next?
Confidently tackle the market’s ups and downs with independent research and analysis that tells you where we think stocks are headed—and why.
Related Resources
-
Weekly Wrap-Up Fisher Investments Reviews: Last Week in Markets — October 5 - October 92026-10-12
-
Politics Context for the Noisy Congress to Come2026-10-09
-
Expert Commentary This Week in Review | S&P 500 Record High, Fed Minutes, Spain Election
 2026-10-09
 -
Interesting Market History Notes on a Bear Market Anniversary2026-10-09




Learn More
Learn why 210,000 clients trust us to manage their money and how Fisher Investments and its affiliates may be able to help you achieve your financial goals.
As of 9/30/2026
New to Fisher? Call Us.
Contact Us Today