Personal Wealth Management / Economics
Q4 GDP Strong, Fine Under the Surface, Too
Even excluding inventories, GDP growth accelerated.

Q4 US GDP jumped 6.9% annualized, beating expectations, but the report didn’t spark much cheer Thursday.[i] Many pundits noticed much of the growth stemmed from a big bump in inventories—and fretted it won’t last—meaning headline growth will likely weaken soon. While that may be, we wouldn’t worry. Looking under the hood at GDP’s pure private sector demand components, growth looked fine.
Exhibit 1 breaks out headline GDP growth (blue line) into two categories: the one mainly in question yesterday, inventories (yellow), and what we like to consider pure private sector domestic demand (green)—broadly, consumer spending and business investment outside inventories. (Note: We exclude government and trade here, which were negligible in Q4.)
Exhibit 1: Steady Underlying Core Demand Growth Post-Reopening
Source: FactSet, as of 1/27/2022. Real GDP and components, Q1 2019 – Q4 2021. Pure private domestic demand aggregates consumer spending and fixed investment categories.
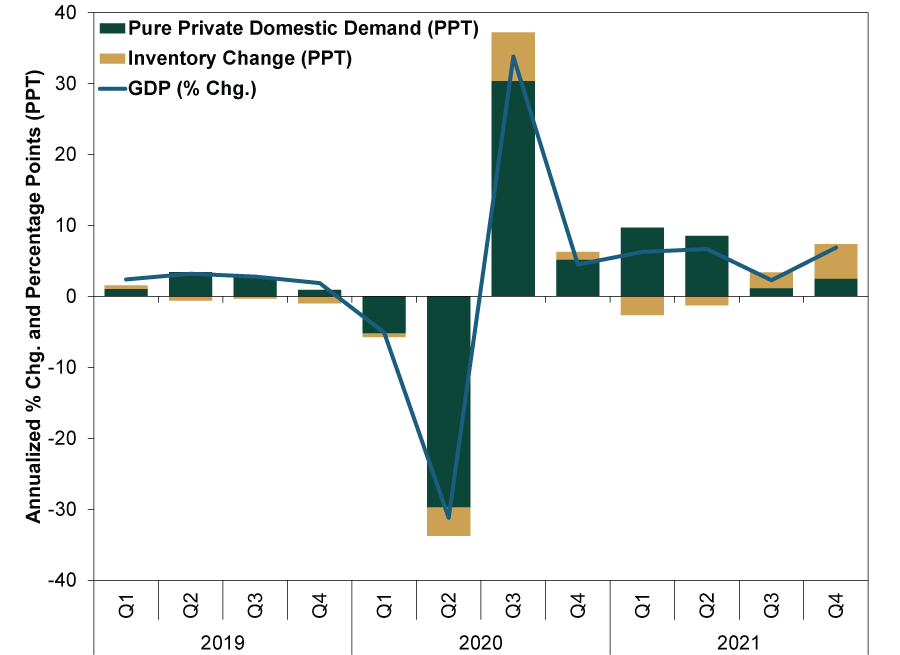
In Q4, you can see inventories’ big contribution. But if you just look at the first bucket, spending and investment, you get a better sense of the underlying economic trend that we think matters for markets. It slowed sharply in Q3 mostly because heady, earlier consumer spending catchup growth rates—11.4% annualized in Q1 and 12.0% in Q2—from mass vaccinations and thawing social-distancing restrictions largely exhausted pent-up demand.[ii]
But that doesn’t mean demand is absent—it just isn’t inflated by prior lockdowns anymore. For instance, Q4 services spending—the majority of household expenditures—rose 4.7% annualized.[iii] Services growth was also broad-based, with all major categories (housing, healthcare, transportation, recreation, food and financial services) contributing to growth. The bedrock of GDP growth remains solid, in our view.
On the investment side, growth resumed after a slight dip in Q3. While business investment can be volatile, particularly for durable goods (think heavy equipment and machinery), quarter-to-quarter fluctuations are normal during overall economic expansion. More interesting under the surface: Tech’s growing influence, particularly intellectual property products (think software, R&D and patents). This category has grown rapidly—and steadily—to become almost a third of all business investment, and it doesn’t look likely to slow down any time soon.
Now, inventories’ 4.9 percentage point contribution to GDP last quarter seems pretty straightforward to us.[iv] Businesses, faced with supply chain chaos and fears of not having enough inventory to meet demand at the holidays and beyond, raced to build stockpiles. As the historically low levels of the Census Bureau’s total inventories-to-sales ratio shows, businesses came into the holiday season with shelves relatively thin.[v] Perhaps they overshot accidentally, or perhaps it was a deliberate pre-emptive move against anticipated supply chain kinks early this year. Either way, it seems fair to expect something of an inventory drawdown in the next couple of quarters. As companies work through stockpiles, GDP growth might slow—hence, the present worry.
But we don’t think this amounts to some massive inventory excess that a recession needs to correct. A single quarter’s build, which was likely centered in December, doesn’t constitute a troubling trend—just a typical adjustment expanding economies often feature, making them more durable longer-term. For example, during 2009 – 2020’s long expansion, inventories detracted for six straight quarters from Q2 2015 to Q3 2016. Recession didn’t ensue. Note, too, that while sharp inventory drawdowns often accompany a recession as businesses get lean and mean, they alone are likely just part of the accumulated excess. That excess is also typically apparent in broader malinvestment in the preceding quarters, which we aren’t seeing right now. Rather, businesses are expanding production to meet acute supply shortfalls. This could snowball into misdirected investment later, but for now, we don’t see cause for alarm.
While watching for signs of excess that will eventually need to be corrected is wise, for now, it doesn’t seem likely. But we do think the fast catchup phase is largely behind us, with growth likely to slow—which is fine for stocks. To us, growth always looked set to slow following reopening—economic activity doing just that shouldn’t surprise. But this wasn’t always obvious to many—or consensus opinion. A year ago, pundits were yapping about a new Roaring Twenties as vaccines rolled out, anticipating a robust decade like the one that followed the 1918 influenza pandemic.
At the time, we cautioned investors to temper their expectations. The Roaring Twenties analogy seemed like a case of correlation without causation, made more convenient by the coincidence of COVID striking in 2020. A return to more pedestrian pre-pandemic growth trends looked more likely to us after the reopening bounce faded. Now, pundits appear to be overcorrecting, saying the economy will hit the rocks as monetary and fiscal “stimulus” runs out. We think such prognostications will also prove wrong.
Pure private sector domestic activity’s acceleration gives you a sense of this, in our view. Q4’s 2.5% annualized growth is about what the pre-pandemic expansion rate was.[vi] Blah? Sure. But it was also fine for stocks throughout the 2009 – 2020 bull market, and we don’t see any indication that should change. We also don’t see much (if any) evidence the economy relies on Fed and Treasury support. Rather, with leading indicators like the yield curve still positive, household finances on fine footing and businesses just starting to pick up where they left off pre-pandemic, growth looks likely to continue.
Outside of supply disruptions and restocking skew, the economy is looking pretty normal, in our view.
[i] Source: Bureau of Economic Analysis, as of 1/27/2022. Real GDP, Q4 2021.
[ii] Ibid. Personal consumption expenditures (PCE), Q1 2021 – Q2 2021.
[iii] Ibid. PCE services, Q4 2021.
[iv] Ibid. Inventory change contribution to GDP growth, Q4 2021.
[v] Source: Federal Reserve Bank of St. Louis, as of 1/28/2022. Total business inventory-to-sales ratio was 1.25 in November, the latest data available.
[vi] Source: Bureau of Economic Analysis, as of 1/27/2022. PCE and fixed business investment, Q4 2021.
If you would like to contact the editors responsible for this article, please message MarketMinder directly.
*The content contained in this article represents only the opinions and viewpoints of the Fisher Investments editorial staff.
Get a weekly roundup of our market insights
Sign up for our weekly e-mail newsletter.

You Imagine Your Future. We Help You Get There.
Are you ready to start your journey to a better financial future?

Where Might the Market Go Next?
Confidently tackle the market’s ups and downs with independent research and analysis that tells you where we think stocks are headed—and why.
Related Resources
-
In The News Bourse : pourquoi l’impact de la guerre en Iran sera moins important que prévu – par Ken Fisher2026-04-01
-
Market Analysis What the Latest Global Flash PMIs Reveal2026-03-31
-
Market Analysis Beyond Iran: A Non-Conflict March Mailbag Q&A2026-03-30
-
Weekly Wrap-Up Fisher Investments Reviews: Last Week in Markets—March 23 - March 272026-03-30


Learn More
Learn why 195,000 clients trust us to manage their money and how Fisher Investments and its affiliates may be able to help you achieve your financial goals.
As of 12/31/2025
New to Fisher? Call Us.
Contact Us Today