Personal Wealth Management / Market Analysis
Unemployment Won’t Push Prices Higher
Among many inflationary pressures, rising wages isn’t one.

The US March jobs report came out last Friday, and it was chock full of goodies. Nonfarm payrolls rose 431,000—the 11th straight month of job gains over 400,000—while the unemployment rate dipped 0.2 percentage point to 3.6%.[i] Many say March’s figures confirm a full recovery is underway, but some still worry rising wages in a tight job market may keep inflation high. However, unemployment and inflation aren’t linked—worth keeping in mind given myriad worries about today’s elevated prices.
The purported connection between unemployment and inflation originates from the Phillips Curve. According to this theory, low unemployment leads to higher wage growth due to higher competition for workers. That forces employers to pass on higher labor costs to consumers, driving broadly rising prices, which drives wages higher, which drives prices higher, lather, rinse, repeat. Economists refer to this phenomenon as a wage-price spiral, and some think one may be forming based on the latest data. Everyone is aware of high inflation rates both here and abroad, and wage growth has been accelerating since April 2021, rising 5.6% y/y in March. (Exhibit 1)
Exhibit 1: Accelerating Wage Growth

Source: FactSet, as of 4/4/2022. Average hourly earnings, year-over-year change, December 2019 – March 2022.
However, we think much of 2021 acceleration reflects the calculation quirk known as the base effect. In April 2020, average hourly earnings jumped 8.0% y/y (4.2% m/m), as lockdown-driven furloughs and layoffs resulted in large numbers of lower-earning workers falling out of the government’s earnings data.[ii] Without those lower numbers in the calculation, the average popped in April. In May and June, though, average hourly earnings fell on a month-over-month basis as people returned to work, which put downward pressure on the average. The rebound since then reflects the slow return to normal, in our view. However, some still worry rising worker pay suggests a wage-price spiral is forming and will keep inflation elevated.
But there is nothing inherently special or forward-looking about wages. They represent the price of labor—determined by supply and demand. Headlines today worry the former can’t keep up with the latter, with a heightened focus on supply constraints (e.g., workers remaining on the sidelines due to other obligations, including caregiving). But labor supply isn’t fixed, and it has been improving. The civilian labor force participation rate (the percentage of the population that is either working or actively looking for work) was 62.4% in March.[iii] While still below its pre-pandemic level of 63.4% in January 2020, the rate has climbed steadily since April 2020’s low of 60.2%.[iv] That suggests workers are returning to the labor force, in part responding to the signal of rising wages.
Moreover, higher worker pay doesn’t automatically fall onto consumers. Sometimes businesses will pass higher wages on, if they think the market can bear it. Other times, they will keep prices low in hopes of gaining market share. Plenty of variables can play into this. Perhaps companies make offsetting cost cuts elsewhere to keep prices low (e.g., removing a less-profitable product line). They could also use their gross margins to absorb labor costs temporarily, on the expectation that future growth will replenish their buffers. Or, they could decide a long-term investment in productivity could yield fruit over time and keep costs down. Firms big and small have been investing in robots to automate certain tedious tasks, including packing products or taking food orders, spurring a nascent “robots as a service” industry.[v]
History also debunks the purported ties between unemployment and inflation. See the 1970s: High unemployment coincided with double-digit inflation, which is the opposite of what the Phillips Curve says should happen.
Exhibit 2: The 1970s Weren’t Nice to the Phillips Curve
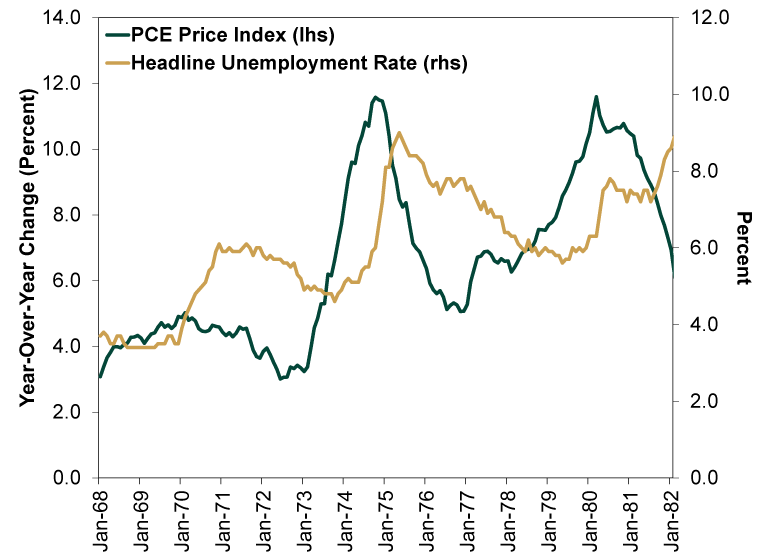
Source: St. Louis Federal Reserve, as of 12/7/2021. US Personal Consumption Expenditures (PCE) Price Index, year-over-year change, and headline unemployment rate, monthly, January 1968 – January 1982.
In our view, the 1970s’ high inflation stemmed from President Nixon’s wage and price controls, the oil price shock due to OPEC’s embargo and years of the Fed’s increase of money supply. Nixon’s controls distorted normal price signals. Fixed prices incentivize companies to produce the minimum, as there is no profit reward for producing more. That causes rationing and shortages, which can contribute to higher prices across the economy once the price ceiling resets. For a more recent example, see the UK’s energy price caps, which have contributed to higher energy costs for households and put many smaller energy suppliers out of business. Furthermore, if companies’ prices are capped, they may fear losses in the future, so they boost prices to the cap near immediately, which turns it into less of a ceiling and more of a target.
The 2009 – 2020 expansion also punched a hole in Phillips Curve thinking. Since 1970, the unemployment rate has averaged 6.2%.[vi] It fell below that threshold in mid-2014 and trended lower for the rest of the expansion. Over that stretch, the annual inflation rate averaged 1.4%, which is below the Fed’s 2% target.[vii] Note, too, that after an uptick in inflation at 2018’s start, prices decelerated mid-year—even as unemployment fell below 4%. Low unemployment didn’t yield faster inflation, debunking the Phillips Curve again.
As we wrote last week, inflation may stay elevated for longer than we initially anticipated. While logistical pressures appeared to be easing, the Russia-Ukraine war drove a fresh batch of supply-side spikes, which will likely keep prices elevated for a while longer. That isn’t great, and we don’t dismiss economic hardships for many households. But as experts discuss why inflation will be high, we think it is worth keeping in mind that labor market developments aren’t the reason why.
[i] Source: FactSet, as of 4/4/2022.
[ii] Ibid.
[iii] Source: US Bureau of Labor Statistics, as of 4/4/2022.
[iv] Ibid.
[v] “Robot Subscription Services Let Companies Automate on the Cheap,” Thomas Black, Bloomberg, 3/31/2022.
[vi] Source: St. Louis Federal Reserve, as of 4/4/2022. Average of monthly U-3 unemployment rate, January 1970 – March 2022.
[vii] Ibid. Personal Consumption Expenditures Price Index, year-over-year change, July 2014 – February 2020.
If you would like to contact the editors responsible for this article, please message MarketMinder directly.
*The content contained in this article represents only the opinions and viewpoints of the Fisher Investments editorial staff.
Get a weekly roundup of our market insights
Sign up for our weekly e-mail newsletter.

You Imagine Your Future. We Help You Get There.
Are you ready to start your journey to a better financial future?

Where Might the Market Go Next?
Confidently tackle the market’s ups and downs with independent research and analysis that tells you where we think stocks are headed—and why.
Related Resources
-
Expert Commentary 3 Things You Need to Know This Week | Q2 Earnings, ECB Meeting, Trump Accounts
 2026-07-20
 -
Weekly Wrap-Up Fisher Investments Reviews: Last Week in Markets—July 13 - July 172026-07-20
-
Expert Commentary This Week in Review | US-Iran Conflict, US Inflation, New UK Prime Minister
 2026-07-17
 -
Market Analysis Pumping Up the Yen?2026-07-17


Learn More
Learn why 210,000 clients trust us to manage their money and how Fisher Investments and its affiliates may be able to help you achieve your financial goals.
As of 6/30/2026
New to Fisher? Call Us.
Contact Us Today