Personal Wealth Management / Economics
What to Make of a Popular Forward-Looking Indicator Today
The Conference Board’s US LEI has been falling for a while—what does it mean for investors?

The Conference Board’s US Leading Economic Index (LEI) fell -0.3% m/m in February—its 11th straight monthly decline. The gauge has a solid reputation as a forward-looking economic indicator, so some see its extended slide as proof a US recession must be underway—or is coming soon. While that is possible, it is by no means a foregone conclusion, as we will explain—nor is it assuredly predictive for stocks.
The US LEI has been around for over 70 years, and today’s version has 10 underlying components. With a handful of exceptions—e.g., a couple of late-lagging labor measures—most of the constituents are forward-looking, including three sets of factory orders, the yield curve spread and the Leading Credit Index (LCI, a Conference Board created gauge of loan availability and demand). Of LEI’s 10 components, 8 were negative or flat in February, extending recent trends. The yield curve spread has now detracted for three straight months, while the LCI has weighed for seven. We won’t sugarcoat anything here—US LEI has been stumbling, understandably contributing to recession chatter.
But we see some caveats worth considering. For example, LEI features goods production over services, even though the latter represent over 70% of GDP. (Contrast that with the components that relate directly to factory orders, which comprise less than 20%.) LEI’s weakness isn’t consistent with services spending’s persistent growth over the past year. (Exhibit 1)
Exhibit 1: LEI Better Predicts Goods Than Services
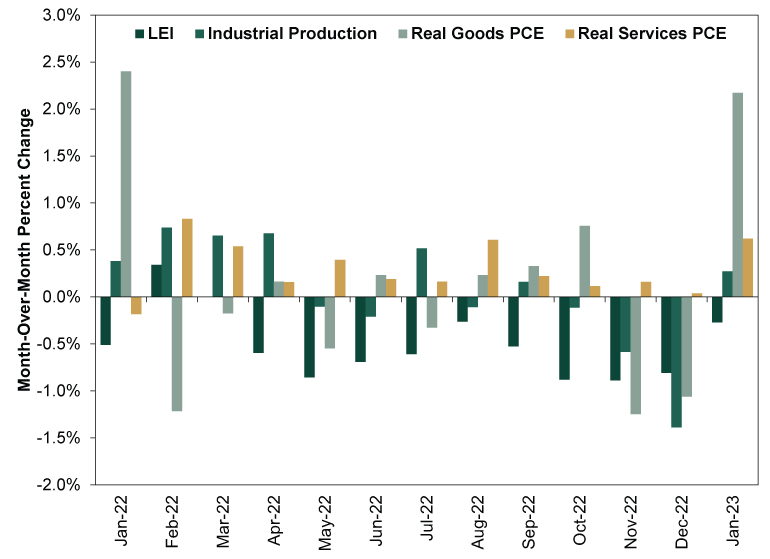
Source: FactSet and US Bureau of Economic Analysis, as of 3/17/2023.
We also think the yield curve spread—a proxy for banks’ future profit margins—may not be as telling of future conditions as it has been historically. Financial institutions borrow at short-term rates to finance long-term loans, with the spread representing lending’s profitability. Banks have a higher incentive to take the risk of lending money if the potential payoff is worthwhile. A wider interest rate spread implies more lending, which means more money available to households and businesses—fuel for growth. But the fed-funds rate, which is the short end of LEI’s rate spread, is detached from lending today. It determines the cost of interbank lending. Yet, overall, banks’ deposit bases are historically huge and cost nearly nothing, making them less reliant on the fed-funds market. They can get funding much cheaper elsewhere. So with long-term rates up, lending is profitable and growing at double-digit year-over-year rates despite Fed rate hikes, limiting the yield curve’s historic predictive power, in our view.
We aren’t dismissing LEI. It is entirely possible its weakness over the past 12 months proves prescient and a mild US recession materializes. But if that happens, it likely wouldn’t surprise. In our view, last year’s bear market suggests US stocks pre-priced domestic economic weakness to a great degree—we saw similar behavior in German markets.
Another wildcard: how the recent regional bank scare affects lending. Even though most US banks are in excellent shape, it is possible they turn ultra conservative and hold more in reserves rather than lend as they wait and see what the Fed does—and whether the societal panic calms. We will monitor weekly loan growth data closely for clues, as the episode could have a broader economic impact, especially if the Fed reinstates reserve requirements in response. That said, LEI’s components don’t yet register these factors, either, so its decline to date doesn’t say whether banking problems are set to ripple now. As telling as LEI is, the measure has its limits, which are worth keeping in mind as recession projections top headlines.
If you would like to contact the editors responsible for this article, please message MarketMinder directly.
*The content contained in this article represents only the opinions and viewpoints of the Fisher Investments editorial staff.
Get a weekly roundup of our market insights
Sign up for our weekly e-mail newsletter.

You Imagine Your Future. We Help You Get There.
Are you ready to start your journey to a better financial future?

Where Might the Market Go Next?
Confidently tackle the market’s ups and downs with independent research and analysis that tells you where we think stocks are headed—and why.
Related Resources
-
Economics Quick Hit: Durably Broad-Based Growth2026-07-29
-
Market Analysis On the Chop in the Oil Market2026-07-29
-
Politics Takaichi Raises Japan’s Wall of Worry2026-07-27
-
In The News Why Kevin Warsh should think twice about hiking interest rates — even as anxiety over the Iran war grows2026-07-27


Learn More
Learn why 210,000 clients trust us to manage their money and how Fisher Investments and its affiliates may be able to help you achieve your financial goals.
As of 6/30/2026
New to Fisher? Call Us.
Contact Us Today