


Personal Wealth Management / Economics
Why Record High Diesel Prices Won’t Stall Economic Growth
Spending on fuel is still spending.

After oil’s spike early this year failed to upend global GDP growth and stocks, diesel’s recent rise to record highs has fears of energy costs once again running wild. Bears say diesel—which fuels America’s trucking fleets—will force retailers and shippers to pass higher prices along throughout the supply chain, sucking spending power. We see a big problem with this theory, though: Diesel’s supposed economic punch is flimsier than advertised. It is all a repackaging of pre-existing energy fears—not the novel threat so many claim.
As Exhibit 1 shows, diesel prices (green line) are at all-time highs, hitting over $6 per gallon for the first time last week. This is despite Brent crude oil (gold line), currently around $100 per barrel, remaining well below peak levels—its $138 April zenith and July 2008’s $144 record. While oil and diesel prices generally move in lockstep, constrained refining capacity due to Middle Eastern and Russia-Ukraine wars has sent “crack spreads”—the price difference between crude inputs and the distillates (like diesel) refined from them—skyward. This is spurring talk of major producers like the US and China banning fuel exports as policymakers fear local shortages. As we will explain, such a move risks backfiring—but thankfully, it doesn’t appear at hand today.
Exhibit 1: Record Diesel Prices
Source: FactSet, as of 9/22/2026.
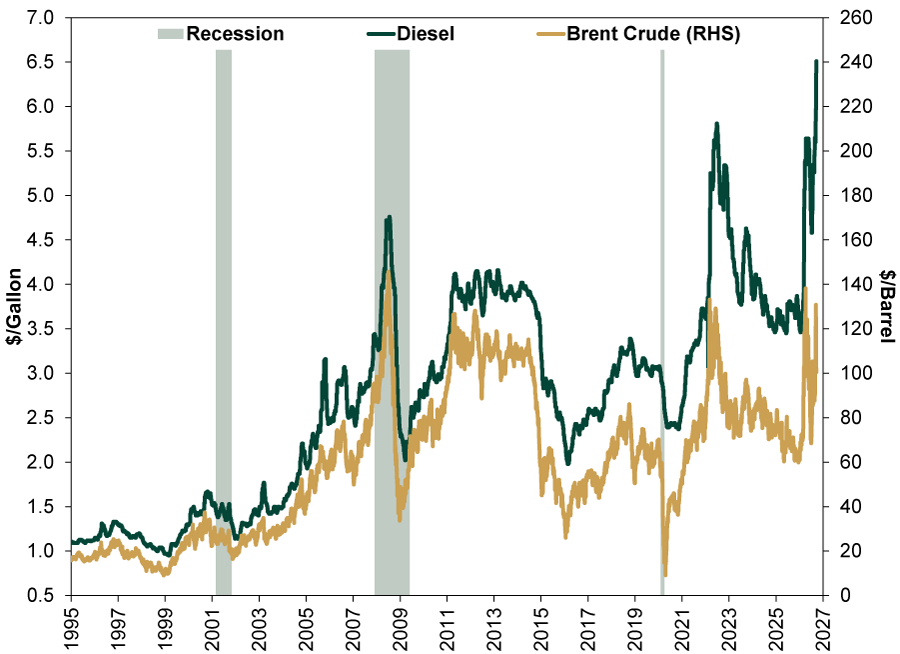
Fear of diesel lifting costs economywide overstates reality. Yes, it is vital for truckers and most US goods are shipped via truck, which some say underpins the broad effects of the fuel price’s rise, as retailers pass on increased shipping costs. But elevated diesel prices aren’t new. Diesel’s $6 a gallon isn’t some critical threshold that will tip the economy into recession any more than oil’s crossing $100 per barrel was. Diesel hit $5.64 per gallon in April. Yet prices outside energy have shown little upward pressure since, as the consumer price index (CPI) ex. energy decelerated to 2.5% y/y in August from 2.9% in May and 2.6% to start the year.[i]
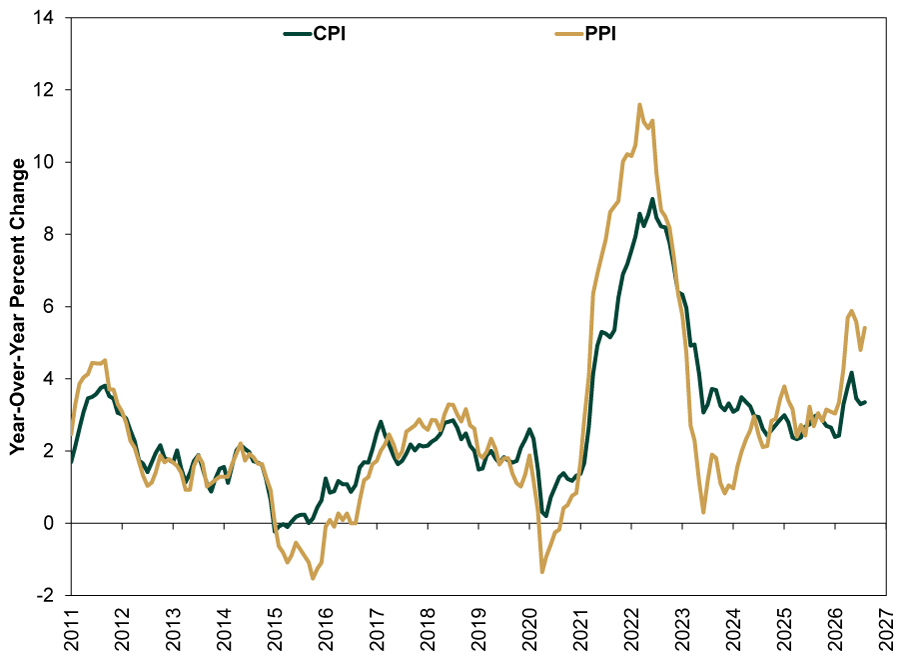
We don’t expect this time to prove much different. Without soaring global money supply growth, companies broadly lack the pricing power to pass increased energy costs on economywide. That was the story with oil earlier, and we think it remains the case now. Diesel costs are further up the supply chain, but the same logic applies. Retailers are reluctant to pass on wholesale price hikes if preserving margins sacrifices revenues—and profits—from their budget-conscious customers. Which as Exhibit 2 shows, is what we have witnessed. In the aggregate, consumer-facing businesses are eating higher wholesale costs—like from freight rates—as measured by the producer price index (PPI), which rose 5.4% y/y in August versus the CPI’s 3.4%. And note: As Exhibit 2 demonstrates, PPI isn’t a harbinger of CPI to come—they tend to move concurrently.
Exhibit 2: Higher Producer Prices Aren’t Being Passed Through
Source: FactSet, as of 9/22/2026.
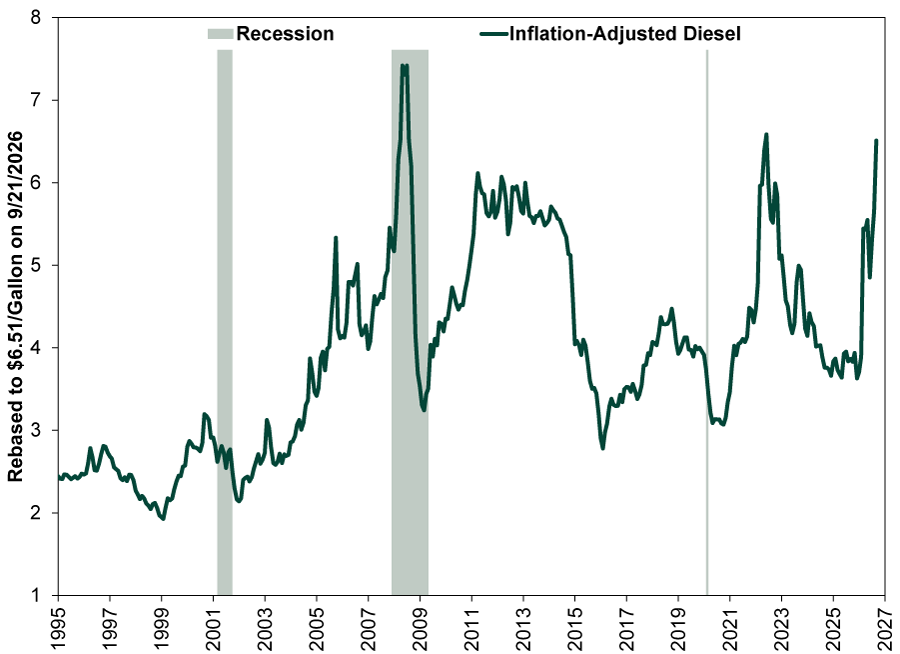
This is why past diesel spikes, even to record highs, didn’t tank the economy. Diesel hit new heights in June 2022, rising above $5.80/gallon, yet recession didn’t ensue—despite runaway money supply growth fueling inflation then. It was one of the cornucopia of fears that contributed to that year’s recessionless bear market, but not the sole driver and no recession followed. On an inflation-adjusted basis, that price is actually higher than today’s.
Exhibit 3: Diesel, Adjusted for Inflation, Remains Below Peak Levels
Source: FactSet, as of 9/22/2016.
Yet today, many say diesel is more threatening. They claim “this time is different” because there are no equivalent European workarounds from Russia-Ukraine war disruptions, which allowed diesel prices’ swift fall from mid-2022. The different-this-time crowd says Ukraine strikes on Russian refineries are escalating, Iranian and Houthi attacks on Gulf pipelines and refineries continue and that petroleum products there are trapped anyway by ongoing blockades.
True enough. Workarounds—and repairs—can take time, especially if under continual bombardment, as in Russia. But Saudi Arabia’s key East-West pipeline restarted today and refining capacity is expected to be restored within weeks—not months. Moreover, China, the Kingdom’s largest customer, has considerable influence over Iran and is pressing Tehran and its proxies to not interfere with Beijing’s energy interests.[ii]
As for export bans, there is talk of that in America—which wouldn’t assure lower prices, unlike what many politicians claim. Many GOP congresspeople see high diesel prices as a threat in the midterm elections and seek something they can tout as their coming to the rescue. However, few think such legislation can pass quickly—and the administration has sent mixed signals on the subject. Which if it falls by the wayside is all for the best: Not only does an export ban fail to address the fundamental lack of refining capacity, it can actually prolong and heighten elevated prices. Interfering in the market like this may have some short-term benefits, but it dissuades local investment, production and import of diesel, threatening higher, not lower, prices in the intermediate term.
Meanwhile, China (among other Asian countries) already implemented some fuel-export bans as the Iran war commenced through early July.[iii] So it could again. But the last time didn’t stop global growth, and we doubt another would result differently.
Proliferating headlines about spiking diesel prices are part of broader false fears around energy. We know and understand some (think: truckers) are suffering from this—and feel for them. But fears that will have much wider economic effects seem false to us.
[i] Source: FactSet, as of 9/22/2026.
[ii] “Saudi Arabia Restarts East-West Oil Pipeline, Sources Say,” Trixie Sher Li Yap, Nidhi Verma and Florence Tan, Reuters, 9/22/2026. “China Presses Iran to Help Rein in Houthis After Saudi Appeal, Sources Say,” Parisa Hafezi, Reuters, 9/17/2026.
[iii] “China Stockpiled Oil, and Now It Could Dominate the Energy Landscape,” Rebecca F. Elliott and Keith Bradsher, The New York Times, 9/17/2026.
If you would like to contact the editors responsible for this article, please message MarketMinder directly.
*The content contained in this article represents only the opinions and viewpoints of the Fisher Investments editorial staff.
Get a weekly roundup of our market insights
Sign up for our weekly e-mail newsletter.

You Imagine Your Future. We Help You Get There.
Are you ready to start your journey to a better financial future?

Where Might the Market Go Next?
Confidently tackle the market’s ups and downs with independent research and analysis that tells you where we think stocks are headed—and why.
Related Resources
-
Weekly Wrap-Up Fisher Investments Reviews: Last Week in Markets — October 5 - October 92026-10-12
-
Politics Context for the Noisy Congress to Come2026-10-09
-
Expert Commentary This Week in Review | S&P 500 Record High, Fed Minutes, Spain Election
 2026-10-09
 -
Interesting Market History Notes on a Bear Market Anniversary2026-10-09




Learn More
Learn why 210,000 clients trust us to manage their money and how Fisher Investments and its affiliates may be able to help you achieve your financial goals.
As of 9/30/2026
New to Fisher? Call Us.
Contact Us Today