Personal Wealth Management / Economics
2018 Doesn’t Prove Rate Hikes Are Bad for Stocks
2018’s stock market correction had another cause, in our view.

Buckle up! That largely sums up pundits’ reaction to the Fed’s decision to “taper” its quantitative easing bond purchases faster than initially planned, reducing monthly purchases by $30 billion instead of $15 billion. The Fed’s statement also set expectations for “similar” monthly reductions from here, a path to ending QE in March—which many presume would tee up a fed-funds target rate hike in 2022’s first half. There is also ample chatter about the “dot plot” of Fed members’ forecasts, showing they collectively project three rate hikes in the year (based on the economic conditions they anticipate, which is hardly etched in stone). That, rather than QE’s impending end, has preoccupied most Fed coverage over the past couple of weeks, with many pundits blaming 2018’s stock market decline on that year’s Fed hikes. While we (nor anyone) can’t predict Fed policy from here, we can correct the record on 2018, which we think had very little to do with the Fed.
As best we can tell, the theory that rate hikes drove 2018’s negativity rests on two observations: The Fed hiked rates throughout the year, and its last increase—on December 19—roughly coincided with the S&P 500’s Christmas Eve low. Yet zeroing in on those facts is a bit too selective, in our view. Consider: The Fed started its rate hike cycle way back in December 2015. The S&P 500 did fine in 2016, rising 12.0%.[i] The next rate hike arrived that December, and three more followed in 2017. Stocks’ party continued, with the S&P 500’s 21.8% return defying rate hike fears.[ii]
Even in 2018, stocks’ woes didn’t align with the Fed’s moves. As Exhibit 1 shows, while full-year returns were negative in a year the Fed hiked four times, that negativity was concentrated in the autumn. After suffering a brief correction (a sharp, sentiment-fueled move of around -10% to -20%) in the winter, the S&P 500 climbed through spring and summer and hit the year’s high point in late September, enduring two rate hikes along the way. In our view, saying the Fed’s decision to raise rates twice in the autumn, for a total 0.5 percentage point increase, caused the S&P 500’s -19.4% decline from that September 20 through Christmas Eve strains credulity.[iii]
Exhibit 1: Stocks Mostly Didn’t Mind Rate Hikes in 2018
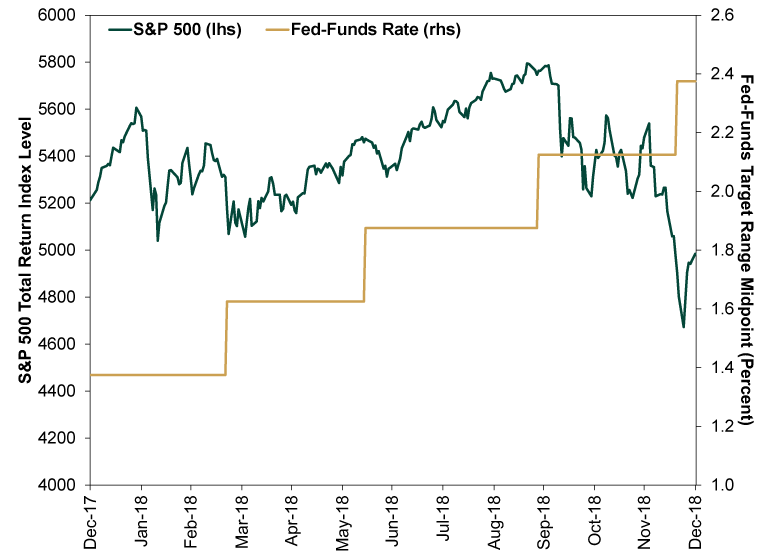
Source: FactSet and St. Louis Fed, as of 12/15/2021. Fed-Funds Target Range Midpoint and S&P 500 Total Return Index, 12/31/2017 – 12/31/2018.
In our view, rate hikes were coincidental to stocks’ late-2018 volatility. The deep correction’s proximate cause, based on our research, was a wave of late-year selling by hedge funds—some that were liquidating holdings to prepare for closure, and some that were raising heaps of cash in anticipation of a flood of redemption requests. In both cases, the culprit was years of poor performance, which resulted in restless shareholders and low revenues under hedge funds’ typical “2 & 20” fee model (charging 2% of assets under management plus 20% of excess returns). Under the 2 & 20 model, performance often doesn’t reset annually, so after a spell of disappointing returns, funds must recoup prior lag before collecting that 20% on excess returns. That means a string of disappointing years can wreck revenues, making it prohibitively expensive to keep operating. For many fund managers, it can become easier to fold and start over than try to keep going in hopes of eventually earning that fee for outperforming.
Hedge fund data is notoriously difficult to come by, as the industry is largely opaque and unregulated. But based on the media’s reporting at the time, our interactions with market makers and our experience, we think scores of hedge funds were in this predicament as 2018 drew to a close. By all indications, hedge funds’ performance was quite dreary in the middle of the last decade. Many managers were pessimistic on stocks after former President Trump won 2016’s election. Those who reduced stock exposure accordingly missed the bulk of the S&P 500’s 27.9% return between Election Day 2016 and 2017’s end.[iv] If they flipped bullish for 2018, they then got whipsawed by stocks’ twin corrections, leaving them in the red on the year by early December. Those who decided to close then had to liquidate holdings in a hurry. Those who remained open were staring down pre-determined redemption windows, and we think they anticipated clients fleeing in January 2019 and decided to raise cash.
As fund managers sold indiscriminately, causing big daily plunges in December, we think it spooked investors broadly, leading to a broad, sentiment-driven selloff—a correction. Late-year rate hikes, in our view, were merely unrelated window dressing.
Rate hikes aren’t inherently bearish, in our view. Like every monetary policy decision, whether they are a net benefit or detriment depends on market and economic conditions at the time, including how they affect the risk of a deep, prolonged, global yield curve inversion. 2018’s rate hikes flattened the yield curve, but they didn’t invert it.[v] Right now, with a roughly 1.4 percentage-point gap between 3-month and 10-year US Treasury yields, an incremental Fed rate hike looks unlikely to cause big money market disruptions.[vi] Maybe that changes by the time the Fed acts, but that isn’t knowable now. Hence, rather than sweat what the Fed might do months in advance, we think it is best to just wait and see and weigh monetary policy decisions after the fact.
[i] Source: FactSet, as of 12/15/2021. S&P 500 total return, 12/31/2015 – 12/31/2016.
[ii] Ibid. S&P 500 total return, 12/31/2016 – 12/31/2017.
[iii] Ibid. S&P 500 total return, 9/20/2018 – 12/24/2018.
[iv] Ibid. S&P 500 total return, 11/8/2016 – 12/31/2017.
[v] There was an inversion about six months after the Fed’s last hike, starting in May 2019. But stocks had already rebounded from December’s correction by then and the inversion was too shallow to have had much effect, in our view.
[vi] Source: FactSet, as of 12/15/2021.
If you would like to contact the editors responsible for this article, please message MarketMinder directly.
*The content contained in this article represents only the opinions and viewpoints of the Fisher Investments editorial staff.
Get a weekly roundup of our market insights
Sign up for our weekly e-mail newsletter.

You Imagine Your Future. We Help You Get There.
Are you ready to start your journey to a better financial future?

Where Might the Market Go Next?
Confidently tackle the market’s ups and downs with independent research and analysis that tells you where we think stocks are headed—and why.
Related Resources
-
Expert Commentary Why Ken Fisher Is Optimistic About European Stocks
 2026-07-23
 -
Economics A Summertime Check-in on US Consumers2026-07-23
-
Market Analysis Why the SOX “Bear Market” Isn’t Foreboding2026-07-21
-
Politics Blunting Burnham?2026-07-21


Learn More
Learn why 210,000 clients trust us to manage their money and how Fisher Investments and its affiliates may be able to help you achieve your financial goals.
As of 6/30/2026
New to Fisher? Call Us.
Contact Us Today