Personal Wealth Management /
The Great Dot Plot Caper
The Fed doesn’t always do as it says.

The Fed’s meeting made news as usual earlier this month, but for once its interest rate decision (keeping its fed-funds target range at 1.50% – 1.75%) wasn’t the big story. Nor was the infamous dot plot’s projection of no rate moves in 2020. Rather, to us the big news was Fed people questioning the dot plot’s usefulness in the first place. When asked, Fed head Jerome Powell said, “I think properly understood, it can be useful but ... if you focus too much on the dots, you can miss the broader picture.” Some piled on, arguing the dot plot should be scrapped. Others agreed with Powell: Take Fed dot plots in context—and skeptically. We find this debate encouraging, as we have long questioned why people focus so much on a report that isn’t even an attempt to forecast the Fed’s decisions. In our view, the more investors understand its limitations and stop seeing it as a divining rod, the better off they will be.
We now have eight years of history to judge the Fed’s dot plots, which show each Fed person’s prediction of the “projected appropriate monetary policy path.” While they occasionally form fun shapes and pictures,[i] their record of predicting Fed action is spotty.
Exhibit 1: The Dot Plot Doesn’t Foretell Policy
Source: Federal Reserve, as of 12/12/2019. Economic Projections of Federal Reserve Board Members and Federal Reserve Bank Presidents, December 2011 – December 2019.
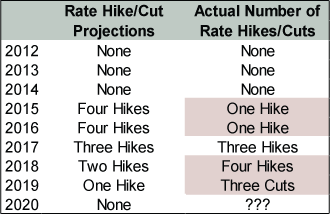
The Fed’s dot plots were right in 2012, 2013 and 2014, when the fed-funds target range was at 0 – 0.25%. That apparent success makes sense when you consider the Fed was still in aggressive “stimulus” mode, pumping open-ended quantitative easing (QE).[ii] Fed people knew rates wouldn’t rise until QE was over. Considering QE didn’t end until late 2014, it isn’t surprising they rightly anticipated interest rates shouldn’t move. After QE ended and the prospect of rate hikes was alive and well, the dot plot started missing much more often than not. In 2015, a commodity-slump driven global economic slowdown kept policymakers from hiking rates for much in the year. Despite anticipating economic data would warrant four rate hikes, they did just one—in December. In the next two years the dot plot was “wrong,” but it at least got the direction of rates right.
Not so for this year. The dot plot published last December envisioned one rate hike this year. Instead, the Fed observed a global manufacturing soft patch, below-target inflation and an inverted yield curve and decided cutting rates would be more optimal. That shows how, like all forecasts, the dot plot is only as good as its inputs. In this case, the inputs being Fed people’s economic forecasts—and their opinion of what interest rates are appropriate alongside those future data points. Getting all of this right is a tall order.
To cut the Fed some slack, the dot plot isn’t predictive because, well, it isn’t supposed to be. Powell even says they aren’t forecasting their own future decisions. Rather, the dot plot is where they expect rates will be if all their other forecasts come to fruition. As Powell explained at the press conference: “It’s an expression of the thinking about individual Committee members, about appropriate monetary policy in the path of the economy ... that policy is always going to depend on the economic outlook and changes in the economic outlook. And when the economic outlook is changing, the dots are, they’re just not a consideration.” Or, like the famous quote often attributed to British economist Lord John Maynard Keynes, “When the facts change, I change my mind.” This is all fine! The problem isn’t the dot plot, but people’s obsession with and interpretation of it. Presuming the dot plot is a forecast is to presume Fed actions are predictable.
But they aren’t. The Fed isn’t a market function—it is a human function. Fed people have different forecasting methodologies and ways to interpret incoming data. All of which is inherently subjective. They also try reading into global economic and financial developments. In 2014 – 2015, oil and commodities were in the headlines. In 2016, Brexit caught its fancy. This year, tariffs. According to meeting minutes, those factored into their interest rate decisions, but good luck figuring out how exactly. Economic outlooks—even the Fed’s variety—are only ever just opinions, which aren’t ironclad.
So, properly understood, we think it is fine if the Fed gets rid of the dot plot. It is also fine if it doesn’t. You just have to avoid being tricked into thinking these outlooks are chiseled in stone. Dot plots don’t add much—if any—value to investors’ decision making. Even if you could forecast the Fed, there isn’t really any good reason to try. Monetary policy works at a lag and has no preset stock market impact. Rate hikes aren’t inherently bad (or good). Rate cuts aren’t inherently good (or bad). Investors generally have plenty of time to asses Fed moves’ impacts after the fact—they don’t need to anticipate them in advance.
By the same token, dot plots aren’t really harmful, either. Although pundits may take them as gospel, markets don’t. Enough people see them correctly that the “wrong” dot plots don’t carry much impact. If some central bankers are questioning dot plots’ usefulness now, what little effect they had before is getting even more watered down.
If you would like to contact the editors responsible for this article, please message MarketMinder directly.
*The content contained in this article represents only the opinions and viewpoints of the Fisher Investments editorial staff.
Get a weekly roundup of our market insights
Sign up for our weekly e-mail newsletter.

You Imagine Your Future. We Help You Get There.
Are you ready to start your journey to a better financial future?

Where Might the Market Go Next?
Confidently tackle the market’s ups and downs with independent research and analysis that tells you where we think stocks are headed—and why.
Related Resources
-
Market Analysis The New Tariffs in Town Are Still Old News2026-07-24
-
Expert Commentary This Week in Review | Market Volatility, Tariffs, SpaceX
 2026-07-24
 -
Expert Commentary Why Ken Fisher Is Optimistic About European Stocks
 2026-07-23
 -
Economics A Summertime Check-in on US Consumers2026-07-23


Learn More
Learn why 210,000 clients trust us to manage their money and how Fisher Investments and its affiliates may be able to help you achieve your financial goals.
As of 6/30/2026
New to Fisher? Call Us.
Contact Us Today