Personal Wealth Management / Economics
Economic Growth to Be Thankful For
A cornucopia of early Q4 US economic data!

Ahead of tomorrow’s Thanksgiving feast, many are trying to finish up work and get on the road before traffic (and weather) gets too rough. So it is with economic statisticians, it seems, which have been busy cranking out economic data ahead of the holiday. For example, today the US Bureau of Economic Analysis issued its second estimate of Q3 US GDP, which revised up growth from 1.9% annualized to 2.1%.[i] While this is interesting for us data wonks, it isn’t too timely, considering it covers a period that ended months ago. Thankfully, though, there are other, more recent data. These early Q4 data tell the story of a US expansion still on solid ground—evidence an important contributor to the global economy continues to chug along.
Consumers Are Spending
Take consumer spending, which accounts for nearly 70% of US GDP. While retail sales tend to get the most attention—especially during the holiday season—they cover only spending on goods and food services. A more comprehensive measure: the BEA’s personal consumption expenditures (PCE) gauge, which also tracks broader services spending—the lion’s share of US consumption. October PCE ticked up 0.3% m/m, the 9th positive read in 10 months.[ii] The latest monthly numbers are consistent with their longer-term trend—demand remains in fine fettle as 2019 nears its conclusion.
Exhibit 1: Steady US Consumer Spending

Source: FactSet, as of 11/27/2019. Month-over-month percent change in US personal consumption expenditures, October 2014 – October 2019.
A Volatile Gauge Points Positively
Another widely watched gauge—durable goods orders—surprised many pundits with a positive reading. Orders rose 0.6% m/m, bouncing back from September’s -1.4% and beating expectations of -0.5%.[iii] Transportation equipment rebounded most, led by orders for aircraft and parts for both defense (18.1% m/m) and nondefense (10.7% m/m).[iv] Notably, non-defense capital goods orders excluding aircraft—“core” capital goods orders, used by many as a proxy for business investment—rose 1.2% m/m, up from September’s -0.5%.[v] Before getting too excited about the surprise, durable goods orders are notoriously volatile—and limited. (Exhibit 2) For example, business investment includes intellectual property and spending on structures and commercial real estate—areas not covered by core capital goods orders. Those caveats aside, October’s monthly growth suggests not all is so dreary in the much-maligned manufacturing sector.
Exhibit 2: Volatile Durable Goods Orders
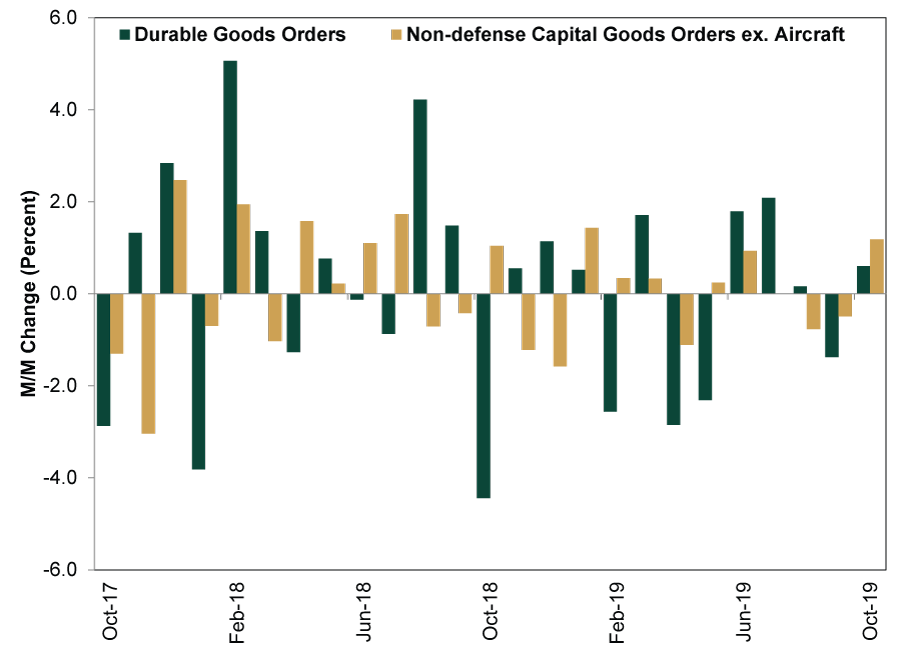
Source: FactSet, as of 11/27/2019. Month-over-month percent change in US durable goods orders and non-defense capital goods orders ex. aircraft, October 2016 – October 2019.
Surveys Say Growth
IHS Markit’s flash purchasing managers’ indexes (PMIs) for November point to another expansionary month. The US’ composite gauge hit 51.9 as both manufacturing (52.2) and services (51.6) registered readings above 50—indicating a majority of firms grew.[vi] PMIs provide only a high-level look at business conditions—they are surveys and lack the detail of “hard” datasets—but they are among the most timely data available to us. In our view, they are further evidence the US’ private sector-led expansion seems alive and well.
Exhibit 3: IHS Markit US Manufacturing and Services PMIs Since November 2016
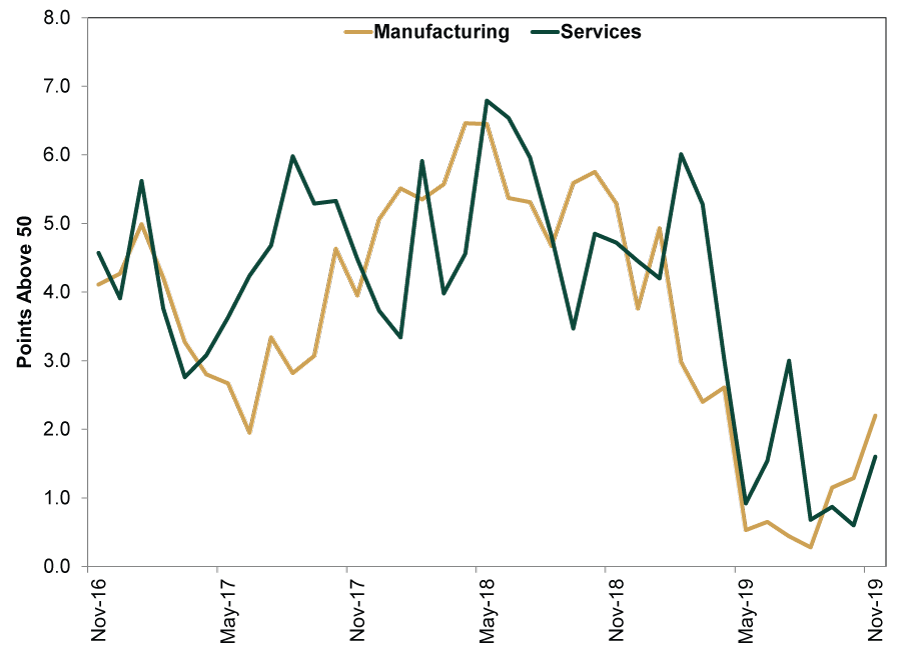
Source: FactSet, as of 11/27/19. IHS Markit PMIs for manufacturing and services, November 2016 – November 2019. Note: November 2019 reflects flash estimates, i.e., reflective of ~85% - 90% of total PMI survey responses.
Despite their methodological differences, the Atlanta, St. Louis and New York Federal Reserve Banks’ GDP “nowcasts”—models that attempt to measure GDP in real time—all project Q4 growth (at 1.7%, 1.6% and 0.7% annualized rates, respectively). These attempts to tally GDP based on incoming and estimated data aren’t perfect, and the numbers fluctuate all quarter long. But they are a good general indication that the data so far point to growth continuing, not slipping into contraction.
While The Conference Board’s Leading Economic Index (LEI) is trending lower, we think this reflects well-known headwinds in the manufacturing sector and shale oil industry. The current weakness resembles very similar bouts seen during mid-cycle slowdowns in 2011 – 2012 and 2015 – 2016. While growth has decelerated in the second half of the year, slowdowns aren’t uncommon during expansions. Dour headlines remain the norm, but the data point to a still-humming US economy—reason for investors to give thanks, in our view.
[i] Source: US Bureau of Economic Analysis, as of 11/27/2019.
[ii] Source: FactSet, as of 11/27/2019.
[iii] Ibid.
[iv] Ibid.
[v] Ibid.
[vi] Ibid.
If you would like to contact the editors responsible for this article, please message MarketMinder directly.
*The content contained in this article represents only the opinions and viewpoints of the Fisher Investments editorial staff.
Get a weekly roundup of our market insights
Sign up for our weekly e-mail newsletter.

You Imagine Your Future. We Help You Get There.
Are you ready to start your journey to a better financial future?

Where Might the Market Go Next?
Confidently tackle the market’s ups and downs with independent research and analysis that tells you where we think stocks are headed—and why.
Related Resources
-
Market Analysis The New Tariffs in Town Are Still Old News2026-07-24
-
Expert Commentary This Week in Review | Market Volatility, Tariffs, SpaceX
 2026-07-24
 -
Economics A Summertime Check-in on US Consumers2026-07-23
-
Expert Commentary Why Ken Fisher Is Optimistic About European Stocks
 2026-07-23


Learn More
Learn why 210,000 clients trust us to manage their money and how Fisher Investments and its affiliates may be able to help you achieve your financial goals.
As of 6/30/2026
New to Fisher? Call Us.
Contact Us Today