Personal Wealth Management / Economics
Leading Indicators Point to Slowing Inflation Ahead
Beyond price measures themselves, signs of improvement in one of this bear market’s big fears abound.

Recent US inflation readings have slowed some, offering investors a modicum of relief. But worry still abounds. Many fear that high inflation won’t subside anytime soon, with October’s readings a false dawn. Pundits say it is “too soon to celebrate” and argue the Fed has more work to do.[i] Perhaps. Monthly inflation data variability is unpredictable. However, we see growing evidence inflation is likely to slow—and defang one of the bear market’s biggest fears this year.
From the headline consumer price index (CPI) and “core” CPI excluding food and energy to producer prices and import prices, inflation has come off the boil since the summer. Yet many argue other measures—like the median CPI or the “sticky price” CPI (a gauge of less-volatile prices)—continue to rise.[ii] While we agree about not reading too much into short-term wiggles, we don’t think various inflation measures—or subsets of them—are any more telling than others. For example, as we showed in February, producer prices don’t reliably lead CPI. They are coincident, rising and falling together. Instead of poring over backward-looking inflation data—past prices, which never predict—we think it is more helpful to take cues from forward-looking measures, which indicate inflation is likely to subside over the coming year.
Exhibits 1 through 3 show a few leading inflation indicators. Now, as the charts also show, these aren’t super-precise gauges. Their lead times to CPI can vary—sometimes by a lot. They won’t pinpoint inflation’s peak, but together, we think the preponderance of evidence they provide gives a good sense of CPI’s likely general direction ahead.
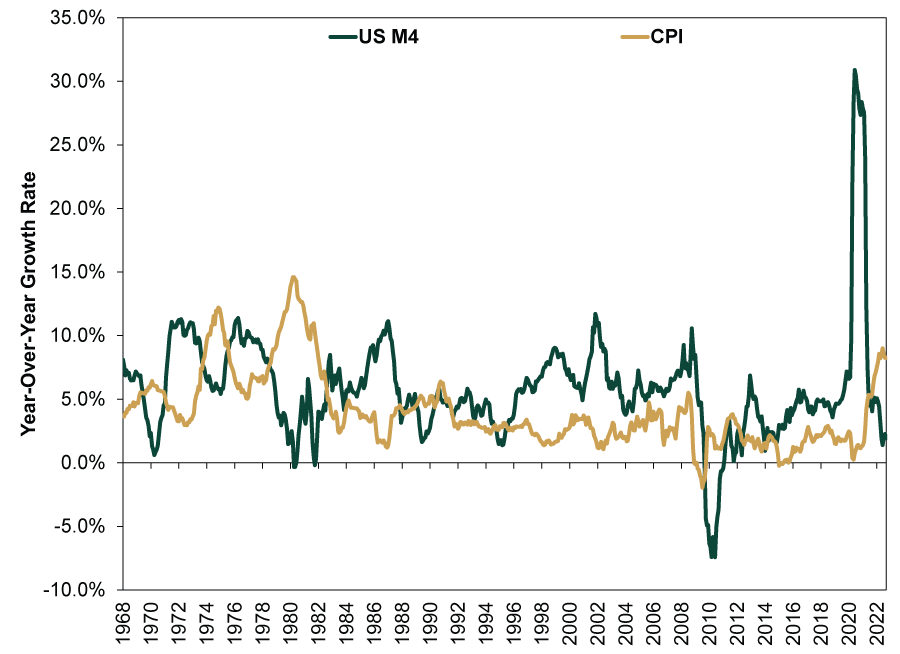
Let us start with money supply. Monetarist theory states that inflation is always and everywhere a monetary phenomenon. So consider M4, the broadest measure of money including highly liquid “near money” substitutes like Treasury bills. Whatever you think of the accuracy of money supply measures, which seem somewhat questionable, the pattern is telling. M4’s most recent spike to over 30% y/y occurred in June 2020. Inflation began escalating about a year later as reopening commenced and demand surged, but M4 growth has since slowed dramatically. It crawled 1.9% y/y in September. Less money sloshing around the system means fewer dollars chasing (up until recently) supply-constrained goods.
Exhibit 1: Money Supply Deceleration Implies Inflation Will, Too
Source: Center for Financial Stability and Federal Reserve Bank of St. Louis, as of 11/17/2022. Divisia M4 (including US Treasurys), January 1968 – September 2022, and CPI, January 1968 – October 2022.
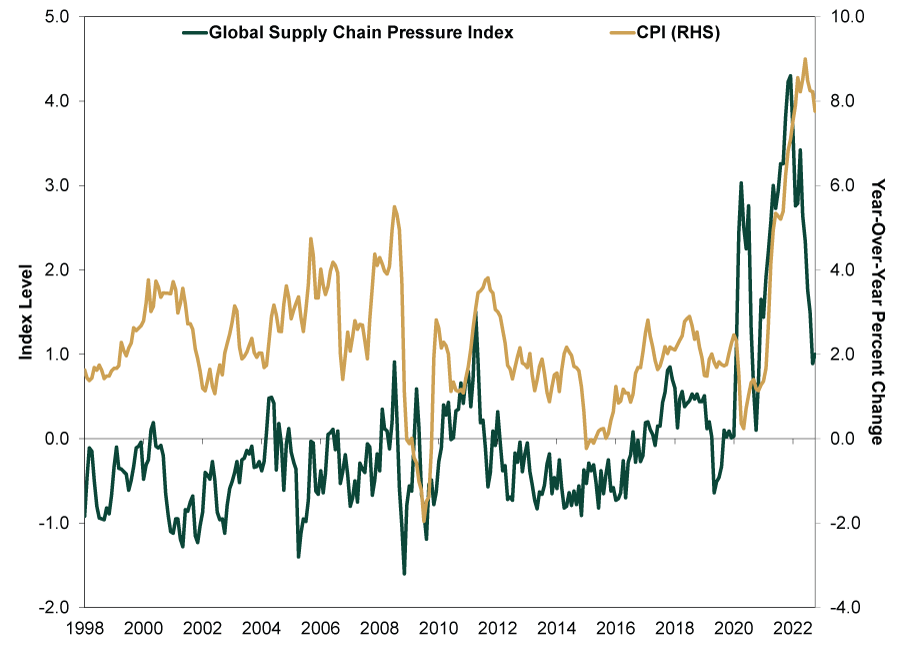
Supply chain issues have featured prominently in this year’s hot inflation, in our view. Yet improvements are showing. We have featured the New York Fed’s Global Supply Chain Pressure Index (GSCPI) a couple times before as a good indicator price pressures are easing. The GSCPI has dropped from over 4.0 late last year to around 1.0 recently. That still shows elevated pressure, but it has eased substantially from the peak.
Exhibit 2: Global Supply Chain Pressure Easing Helps Relieve Price Pain
Source: Federal Reserve Banks of New York and St. Louis, as of 11/17/2022. Global Supply Chain Pressure Index and CPI, January 1998 – October 2022.
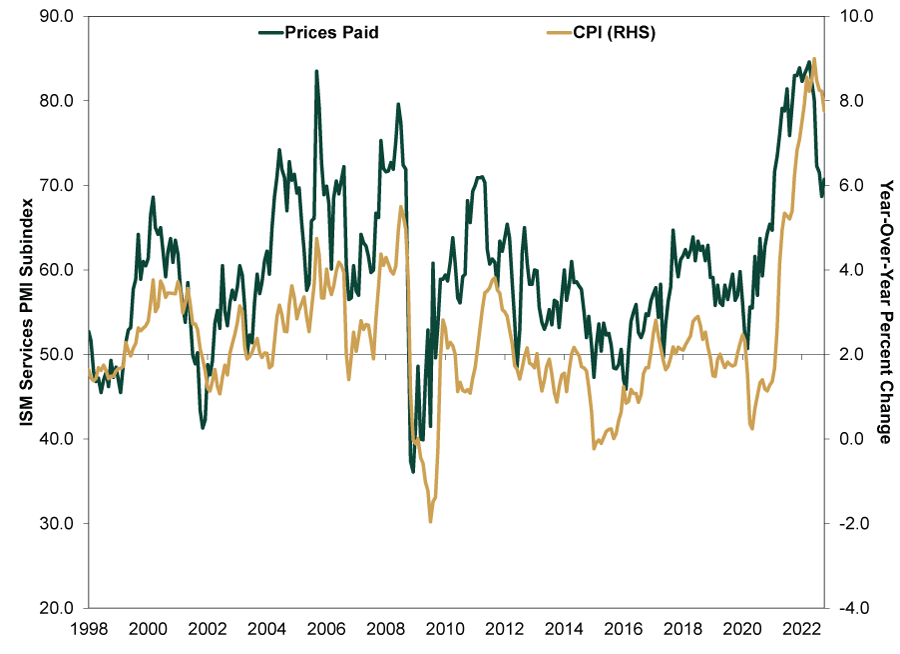
The Institute for Supply Management (ISM) prices paid purchasing managers’ subindex for the services sector offers a separate look at input prices firms representing 71% of GDP are seeing.[iii] Around 70% of services firms surveyed in October say the prices they pay are rising—historically elevated, like the GSCPI—but that has come down from nine straight months of readings above 80% through June. Meanwhile, the sister manufacturing survey showed more respondents noted falling input prices than rising.[iv]
Exhibit 3: Services Firms Are Also Seeing Slower Price Growth
Source: FactSet and Federal Reserve Bank of St. Louis, as of 11/17/2022. ISM services purchasing managers’ index (PMI) prices paid subindex and CPI, January 1998 – October 2022.
Markets reflect likely easing inflation pressures, too. Exhibit 4 shows the average inflation rate over the next five years implied by the difference between 5-year Treasury and Treasury Inflation-Protected Securities yields has fallen to 2.3% from a high of nearly 3.6% in March.
Exhibit 4: The Bond Market Expects Inflation to Moderate
Source: Federal Reserve Bank of St. Louis, as of 11/17/2022. 5-Year Breakeven Inflation Rate, 1/2/2003 – 11/16/2022.

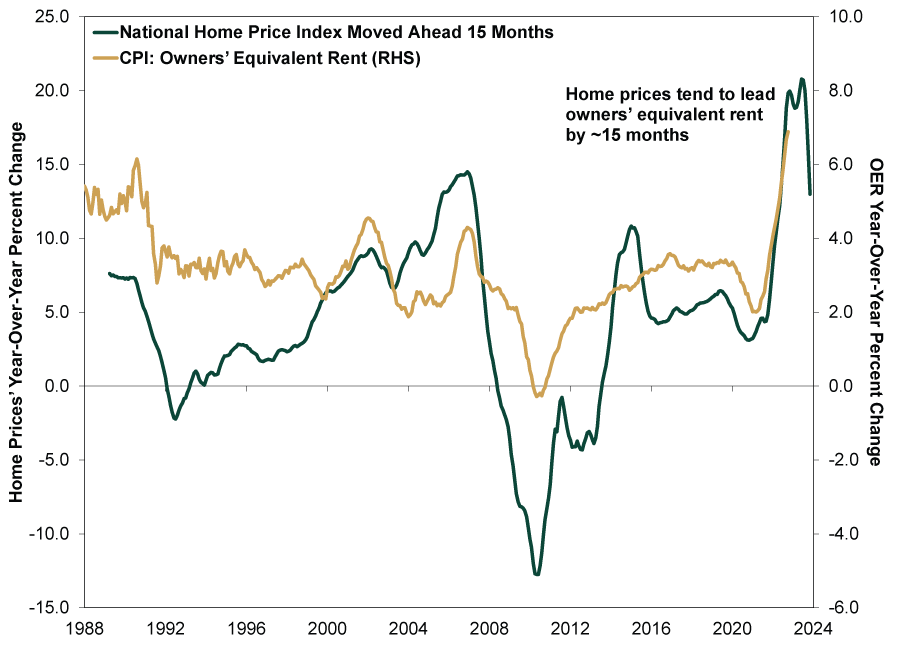
Meanwhile, the S&P/Case-Shiller National Home Price Index has shown cooling prices for months now, and it typically leads shelter costs—among those “sticky” prices some warn are still rising. As Exhibit 5 shows, home prices tend to lead the CPI’s owners’ equivalent rent (OER) component—the single-largest CPI category at a nearly 25% weight—by around 15 months. Now, OER is an illusory line item in CPI, because it represents the costs of what homeowners would pay if they rented their house. The BLS imputes it from the relatively small sample size of single-family home occupants renting their primary residence. But regardless, actual rental rates have decelerated to 4.7% y/y in October, down rapidly from January’s 17.4% peak, according to Realtor.com.[v]
Exhibit 5: Home Price Growth and Rental Rates Starting to Decelerate
Source: FactSet and Federal Reserve Bank of St. Louis, as of 11/17/2022. S&P/Case-Shiller National Home Price Index, January 1988 – August 2022, and CPI: owners’ equivalent rent, January 1988 – October 2022. The Home Price Index is pulled 15 months forward for illustrative purposes.
Continually escalating grocery bills may also be in the rearview before too long. The UN Food and Agricultural Organization (FAO) Food Price Index—international prices for food commodities the FAO measures—has steadily slowed since spring. From 34% y/y in March (when Russia invaded Ukraine, both major agricultural exporters), food prices were up 2% in October.[vi] This may not yet show in falling prices you are paying, but it is an encouraging signal that upward pressure is abating.
Inflation was a key factor in souring sentiment this year, hurting stocks. We don’t think inflation itself fundamentally caused 2022’s bear market. After all, the US economy has (so far) avoided recession despite widespread fear—and an impending one in coming quarters isn’t assured. Meanwhile, corporate profit margins and investment have held up rather resiliently. But now, signs of inflation pressure ebbing suggest that dour inflation sentiment may be overdone—bringing relief. It may not come in a straight line—few economic or market factors do. But it does seem likely to come soon, almost no matter what you think drove inflation this year.
[i] “Inflation Isn’t Dead Yet,” Editors, Bloomberg, 11/15/2022. “Wait, This Is The Inflation News Everyone Is Celebrating?” Editorial Board, Issues & Insights, 11/15/2022.
[ii] Source: Federal Reserve Bank of St. Louis, as of 11/17/2022. Sticky Price Consumer Price Index less Food and Energy, October 2022. “Are Some Prices in the CPI More Forward Looking Than Others? We Think So.,” Michael F. Bryan and Brent H. Meyer, Federal Reserve Bank of Cleveland, 5/19/2010. “Cleveland Fed: Median CPI Increased 0.5% and Trimmed-Mean CPI Increased 0.4% in October,” Bill McBride, Calculated Risk, 11/10/2022.
[iii] Source: BEA, as of 11/17/2022.
[iv] Source: FactSet, as of 11/17/2022. ISM manufacturing PMI prices paid subindex, October 2022.
[v] “October Rental Report: Rent Prices Fall for the Third Straight Month,” Jiayi Xu, Realtor.com, 11/17/2022.
[vi] Source: FactSet, as of 11/17/2022. FAO Food Price Index, March 2022 – October 2022.
If you would like to contact the editors responsible for this article, please message MarketMinder directly.
*The content contained in this article represents only the opinions and viewpoints of the Fisher Investments editorial staff.
Get a weekly roundup of our market insights
Sign up for our weekly e-mail newsletter.

You Imagine Your Future. We Help You Get There.
Are you ready to start your journey to a better financial future?

Where Might the Market Go Next?
Confidently tackle the market’s ups and downs with independent research and analysis that tells you where we think stocks are headed—and why.
Related Resources
-
Market Analysis The New Tariffs in Town Are Still Old News2026-07-24
-
Expert Commentary This Week in Review | Market Volatility, Tariffs, SpaceX
 2026-07-24
 -
Economics A Summertime Check-in on US Consumers2026-07-23
-
Expert Commentary Why Ken Fisher Is Optimistic About European Stocks
 2026-07-23


Learn More
Learn why 210,000 clients trust us to manage their money and how Fisher Investments and its affiliates may be able to help you achieve your financial goals.
As of 6/30/2026
New to Fisher? Call Us.
Contact Us Today