Personal Wealth Management / Economics
More on America's (Small) Yield Curve Inversion
Banks’ funding costs and loan revenues remain nicely far apart.

The US’s yield curve inverted again this week, reigniting fears of a looming recession. Our view, discussed at length in March and early April, remains unchanged: Such a shallow inversion (12 basis points between the 3-month and 10-year US Treasury yields, as of market close on Thursday) is largely indistinguishable from a flat or slightly positive curve, and overall, the global yield curve matters most. We live in a world where big banks can borrow in one country, hedge for currency risk if they like, and lend in another—seizing arbitrage opportunities from different countries’ different interest rates. Today’s global yield curve is positively sloped, helped both by negative short-term rates across Europe and Japan as well as relatively high US long rates. So we see plenty of potential for positive surprise, rendering yield curve dread—which sets expectations low and bakes fear into the marketplace—a rather bullish helper for stocks.
Here is another reason we don’t buy into today’s fears: While the yield curve influences banks’ profits, which drive lending, it isn’t a perfect proxy. Banks do indeed borrow at short rates, lend at long rates and profit off the spread. But they do so at market-set rates, not Fed-set overnight rates or long-term government bond rates. Government yields are reference rates only. So to gauge whether bank lending is still profitable, you must look at actual bank rates. As the next several charts show, these remain favorable for lending even as the yield curve flounders.
Presently, the effective fed-funds rate is 2.39%, while 3-month US Treasury yields are 2.37%.[i] But banks are not paying anywhere near that much to borrow money. Exhibit 1 shows a smattering of short-term interest rates, including checking accounts, savings accounts, money market funds and 3-month CDs. All are well below 1%.
Exhibit 1: A Smorgasbord of Short-Term Bank Funding Costs Vs. Their Benchmarks
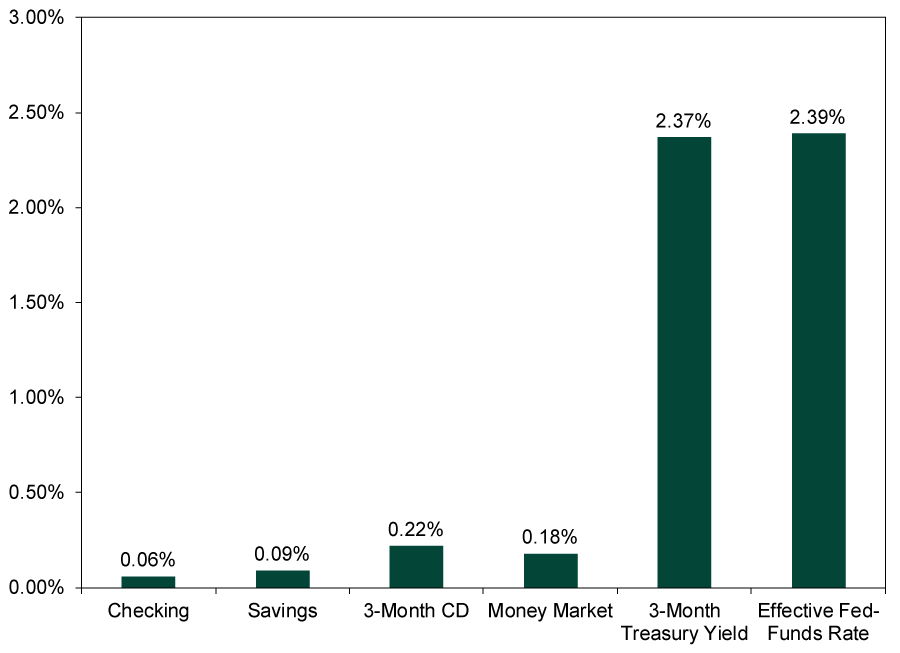
Source: St. Louis Federal Reserve and FactSet, as of 5/30/2019. National rates on non-jumbo checkable deposits, non-jumbo savings accounts, non-jumbo 3-month CDs and non-jumbo money market deposits on 5/20/2019, the latest data available; constant-maturity 3-month and effective fed-funds rate on 5/30/2019.
Consider what drives interest rates in the open market, and it is easy to see why banks’ funding costs are so low. Supply and demand rule the day, as always. Supply—the amount of money banks hold in reserve, in this case—is abundant. It is also global, considering many in Europe and Japan are likely seeking ways to avoid negative rates there. Again, money is really good at crossing borders. Meanwhile, here is a dirty little secret: Banks don’t want all these deposits. They are already drowning in cash, with over $1.4 trillion still parked at the Fed as excess reserves. So they have no compulsion to compete for deposits by offering higher rates. That is frustrating for us as savers. But for banks, it keeps funding costs low, which is half of the equation for lending.
As for the other half—loan revenues—things also look good here from banks’ perspective. Exhibit 2 shows the national average 30-year fixed mortgage interest rate and the average prime rate, which banks use to price many business loans. Note, due to data availability, we are showing the mortgage rate and Treasury yields on May 30, while the prime rate is the average during April. But even if it has ticked down a bit in the month since, we rather doubt it has plunged far below mortgage rates.
Exhibit 2: Key Bank Loan Rates Vs. Their Benchmarks
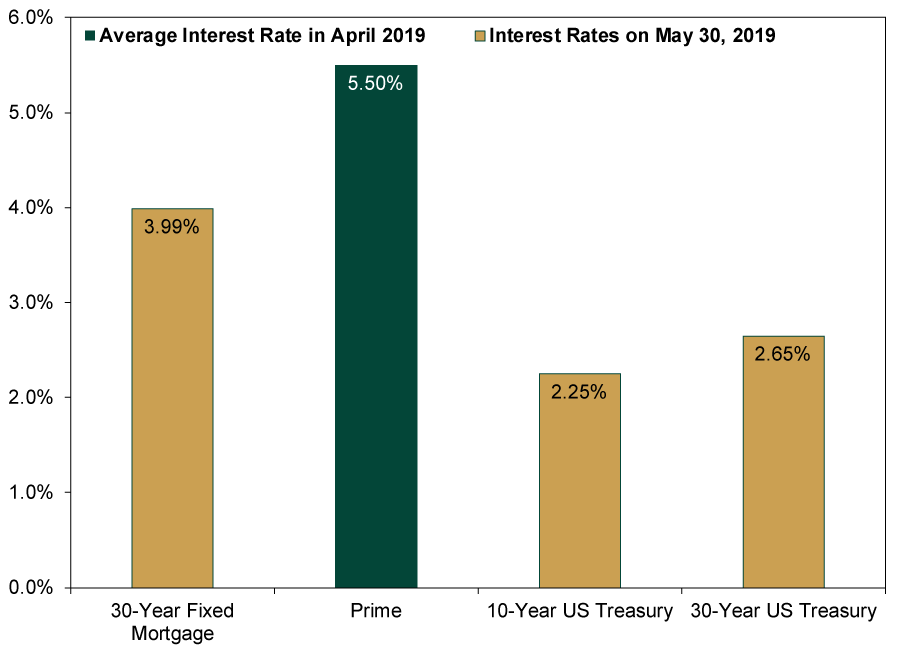
Source: St. Louis Federal Reserve and FactSet, as of 5/30/2019. National average 30-year fixed mortgage rate and constant maturity 10-year and 30-year US Treasury yields on 5/30/2019. National average prime rate in April 2019.
With loan rates so comfortably above borrowing costs, profit margins remain healthy—encouraging more lending. As Exhibit 3 shows, banks’ net interest margins (NIMs) in Q1 were the highest since Q4 2012. Considering neither funding costs nor loan rates have moved a ton thus far in Q2, it seems highly unlikely NIMs are tanking and endangering loan growth at the moment.
Exhibit 3: Banks’ Net Interest Margins Are Holding Steady
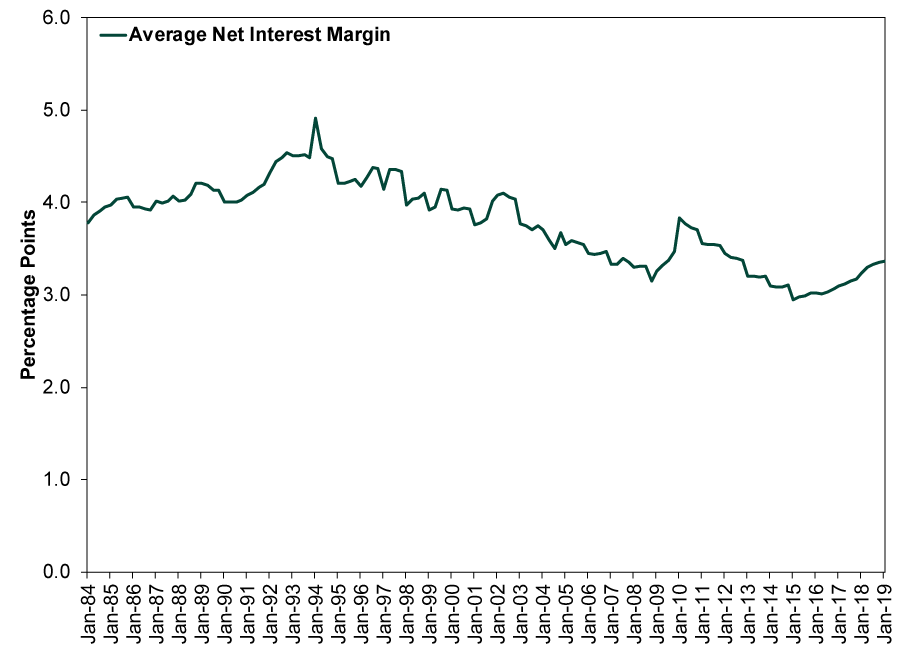
Source: St. Louis Federal Reserve, as of 5/30/2019. Average net interest margin for all US banks, quarterly, Q1 1984 – Q1 2019.
We aren’t saying to blow off the yield curve. There is a reason an inverted US yield curve has preceded every US recession since WWII. But it isn’t a timing tool by any stretch of the imagination, and trouble generally doesn’t start until the US yield curve has inverted deeply enough and for long enough to pull the global yield curve down with it, wiping away interest rate arbitrage opportunities. Even then, an inverted global curve isn’t a timing tool, as monetary policy hits at a lag—and, as shown above, what matters most are banks’ rates, not government rates. So for now, we suggest letting others’ false yield curve fears be bricks in this bull market’s proverbial wall of worry.
[i] Source: FactSet, as of 5/30/2019.
If you would like to contact the editors responsible for this article, please message MarketMinder directly.
*The content contained in this article represents only the opinions and viewpoints of the Fisher Investments editorial staff.
Get a weekly roundup of our market insights
Sign up for our weekly e-mail newsletter.

You Imagine Your Future. We Help You Get There.
Are you ready to start your journey to a better financial future?

Where Might the Market Go Next?
Confidently tackle the market’s ups and downs with independent research and analysis that tells you where we think stocks are headed—and why.
Related Resources
-
Market Analysis Pumping Up the Yen?2026-07-17
-
Expert Commentary This Week in Review | US-Iran Conflict, US Inflation, New UK Prime Minister
 2026-07-17
 -
Market Analysis Business Friendly Bureaucracy or No, Britain is Growing2026-07-16
-
Economics Don’t Doubt the Old World2026-07-16


Learn More
Learn why 210,000 clients trust us to manage their money and how Fisher Investments and its affiliates may be able to help you achieve your financial goals.
As of 6/30/2026
New to Fisher? Call Us.
Contact Us Today