Personal Wealth Management / Economics
Rounding Up Major Global GDP Figures for Q1
What to make of some rather ugly results?

Japan reported Q1 GDP this morning, rounding out the preliminary results of COVID-19’s impact on major developed economies, and as most everyone expected, the Land of the Rising Sun joined Germany, France and Italy in recession. As we warned readers a few weeks ago when the US reported GDP, national statistics agencies’ various reporting preferences may make comparing countries’ growth rates difficult. Hence, we have done the math to bring everything in line and show what the results do—and don’t—mean for stocks.
Under more typical circumstances, the variance among countries’ GDP growth rates wouldn’t get a ton of scrutiny—just a quick “A is growing faster than B,” and then everyone moves on. But in the COVID-19 era, investors are desperate for any hint of how the virus and the related stay-at-home orders are affecting the global economy, particularly with countries’ lockdowns (and reopenings) on differing timetables. Just looking at news coverage or national statistics bulletins probably won’t give you everything you need to know, however, because countries use different reporting methods. The eurozone and most of its member-states focus on year-over-year or quarter-over-quarter results. The former is the percentage change between GDP in Quarter X versus the same quarter in the prior year. The latter is the percentage between GDP in Quarter X and the preceding, usually with seasonal adjustments. The US and Japan report GDP growth at seasonally adjusted annualized rates, which is what you get if you compound the quarterly growth rate over a full year. So to make life easier for you and us, we made Exhibit 1, which displays seven major nations’ (plus the eurozone’s) annualized GDP growth rates over the past three quarters.
Exhibit 1: Annualized GDP Growth Rates
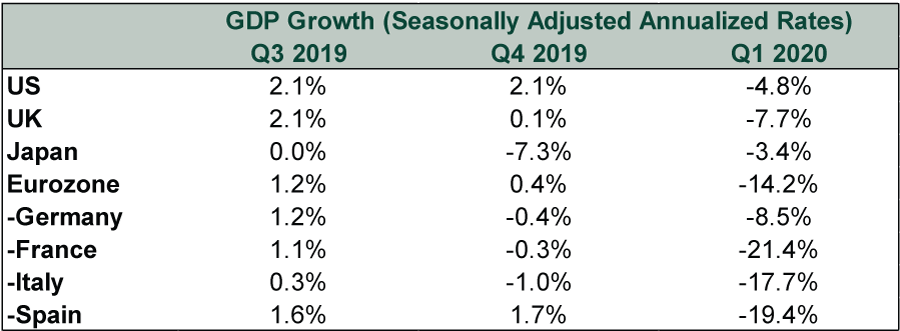
Source: FactSet and Destatis, as of 5/18/2020.
It might be tempting to look at this and make judgments about each country’s inherent strength and ability to weather the storm, but we don’t recommend going down that route. In our view, the staggered implementation of stay-at-home policies explains most of the difference. The eurozone’s lockdown started a couple of weeks before most US shelter-in-place orders kicked in. The UK’s started around the same time as America’s, and household consumption in both nations took similar hits—the UK just didn’t get a boost from government spending and had a sharper contraction in exports.[i] As for Japan, its COVID restrictions were the last to take effect, and GDP fell from a lower base due to Q4’s sharp contraction, which stemmed from October’s sales tax hike. So while the decline’s pace slowed and beat expectations, it isn’t pretty, and it would be a mistake to portray Japan as improving, in our view.
We think the only conclusion to draw from these data is the obvious one: Restricting economic activity in hopes of slowing COVID’s spread caused economic activity to fall. The relatively worse results stemming from Continental Europe may hint at the extent to which Q2 data will worsen in the US and UK, but with both countries starting to reopen gradually, we wouldn’t overstate the predictive power. There are just too many moving parts, with too much country-specific nuance.
Therefore, from an investment standpoint, we think it is more meaningful to highlight what these data don’t tell us. One, whether good or bad, last quarter’s GDP numbers don’t dictate where stocks will go from here. Stocks move ahead of economic trends. They fell before GDP (and earlier monthly data) did. Whenever the recovery begins (if it hasn’t already), it will likely do so before GDP improves—just as the 2007 – 2009 bear market ended months before its accompanying recession ceased. Two, GDP leaders and laggards don’t necessarily translate to leaders and laggards from a national stock return standpoint. Stocks move most on the gap between reality and expectations, and GDP isn’t the only variable affecting either. Sector concentrations and general sentiment matter quite a lot, too. In other words, we don’t see Q1’s GDP results as a screaming argument to overweight Japan. They are simply one more piece of evidence showing this economic contraction is bad.
They probably won’t be the last, either. But with abundant chatter already swirling about how bad Q2 GDP will be and many pundits already starting to dismiss an eventual recovery as a meaningless jump off a low base, potential negative surprise power seems to be falling by the day.
If you would like to contact the editors responsible for this article, please message MarketMinder directly.
*The content contained in this article represents only the opinions and viewpoints of the Fisher Investments editorial staff.
Get a weekly roundup of our market insights
Sign up for our weekly e-mail newsletter.

You Imagine Your Future. We Help You Get There.
Are you ready to start your journey to a better financial future?

Where Might the Market Go Next?
Confidently tackle the market’s ups and downs with independent research and analysis that tells you where we think stocks are headed—and why.
Related Resources
-
Market Analysis Why the SOX “Bear Market” Isn’t Foreboding2026-07-21
-
Politics Blunting Burnham?2026-07-21
-
Expert Commentary 3 Things You Need to Know This Week | Q2 Earnings, ECB Meeting, Trump Accounts
 2026-07-20
 -
Weekly Wrap-Up Fisher Investments Reviews: Last Week in Markets—July 13 - July 172026-07-20


Learn More
Learn why 210,000 clients trust us to manage their money and how Fisher Investments and its affiliates may be able to help you achieve your financial goals.
As of 6/30/2026
New to Fisher? Call Us.
Contact Us Today