Personal Wealth Management / Politics
S&P 500 Performance Around the Past 14 Midterm Elections
History shows a weak start to the midterm season doesn’t prevent a historically bullish phenomenon from materializing.

With Q4 underway and midterm elections just days away, US stocks are entering a historically bullish three-quarter stretch, as Ken Fisher discussed in his June 3 USA Today column and this video. Since 1926, S&P 500 returns during Q4 of the midterm year—and each of the subsequent two quarters—have been positive 87% of the time, far above stocks’ non-midterm 64.6% quarterly frequency of positivity.[i] In the 23 historical nine-month periods between September 30 of a midterm year and the subsequent June 30, US stocks rose 21 times—a 91.3% frequency. But this year, markets’ rocky October—in which the S&P 500 fell -6.9%—has some wondering if midterms’ bullish impact has been preempted.[ii] In our view, there is little reason to suspect so at this point. Weakness in advance of US midterm elections is surprisingly common. The S&P 500 declined in eight midterm-year Octobers since 1926.[iii] Q4 finished negative just twice. The nine-month period? Only once—in 1930. Simply, seeing weakness at times—especially ahead of the vote—isn’t uncommon. The following are charts of the S&P 500 for every midterm year and subsequent two quarters going back to 1962. You have to go all the way back to 1958 to find an example where the market didn’t experience some sort of weakness in advance of the midterm election. In our view, this illustrates the fact weakness before the vote doesn’t negate midterms’ bullish impact.
Exhibit 1: 1962 – 1963
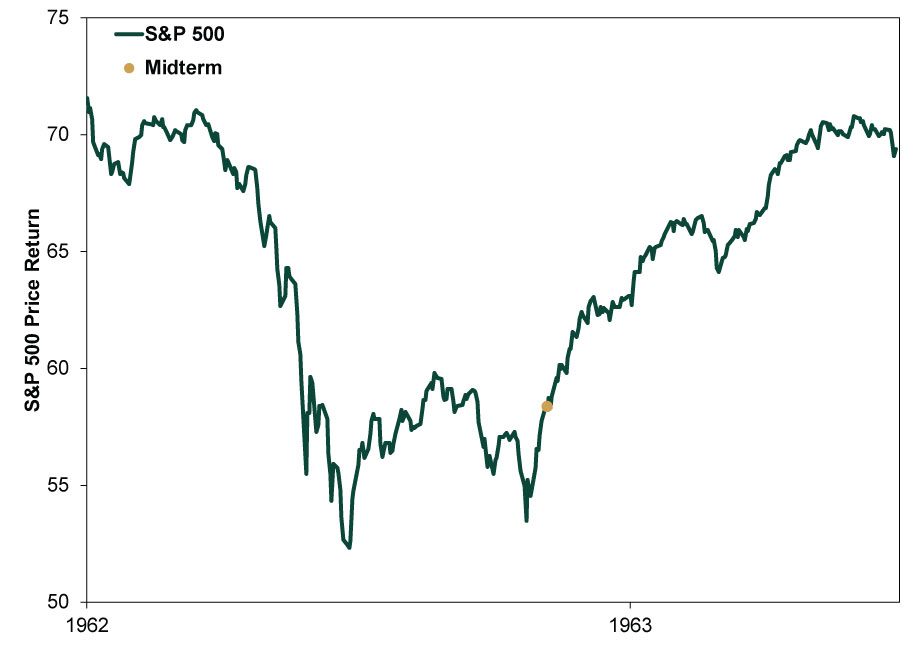
Source: FactSet, as of 10/30/2018. S&P 500 price index level, 1/1/1962 – 6/28/1963.
Exhibit 2: 1966 – 1967
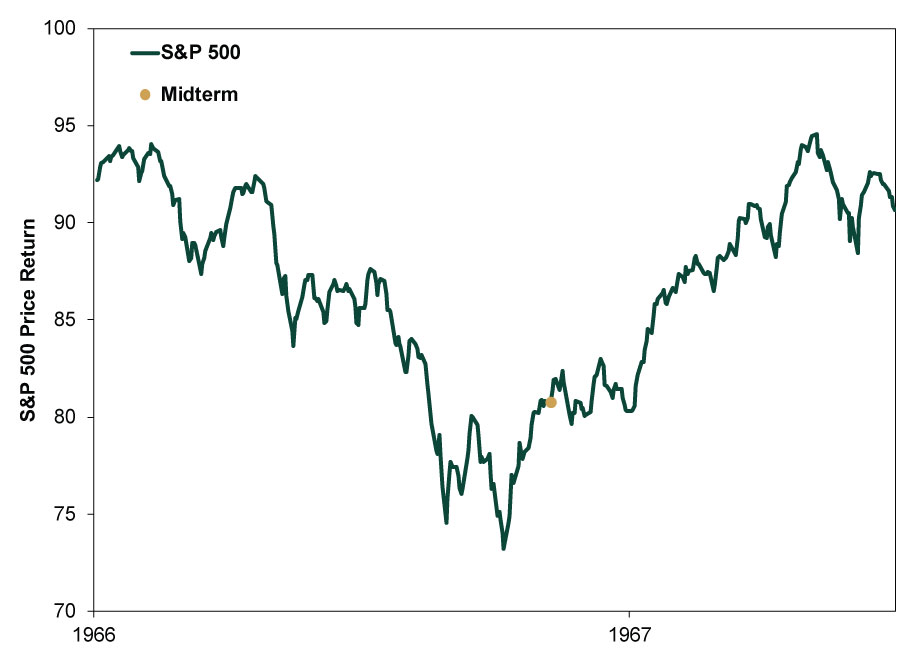
Source: FactSet, as of 10/30/2018. S&P 500 price index level, 1/3/1966 – 6/30/1967.
Exhibit 3: 1970 – 1971
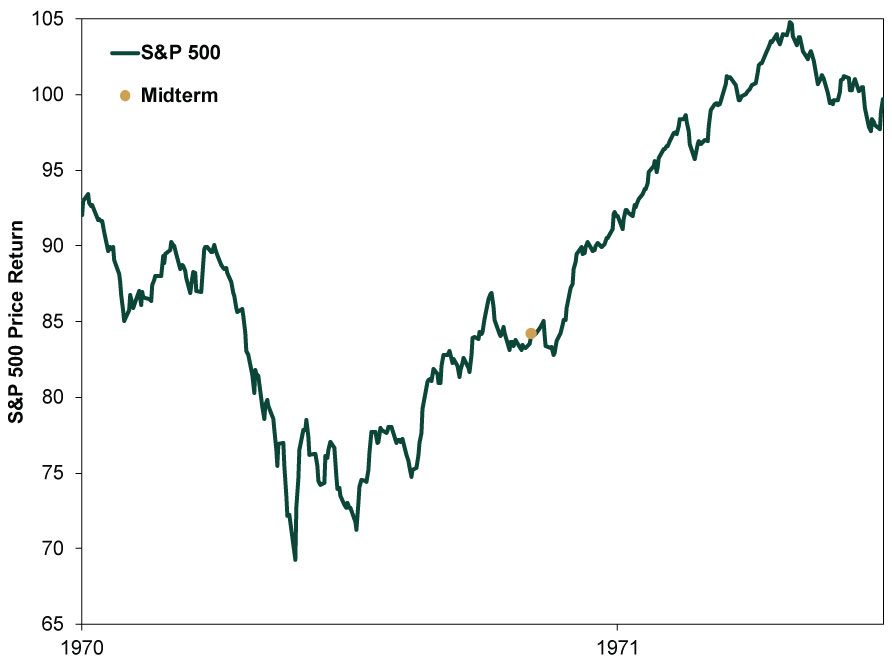
Source: FactSet, as of 10/30/2018. S&P 500 price index level, 1/1/1970 – 6/30/1971.
Exhibit 4: 1974 – 1975
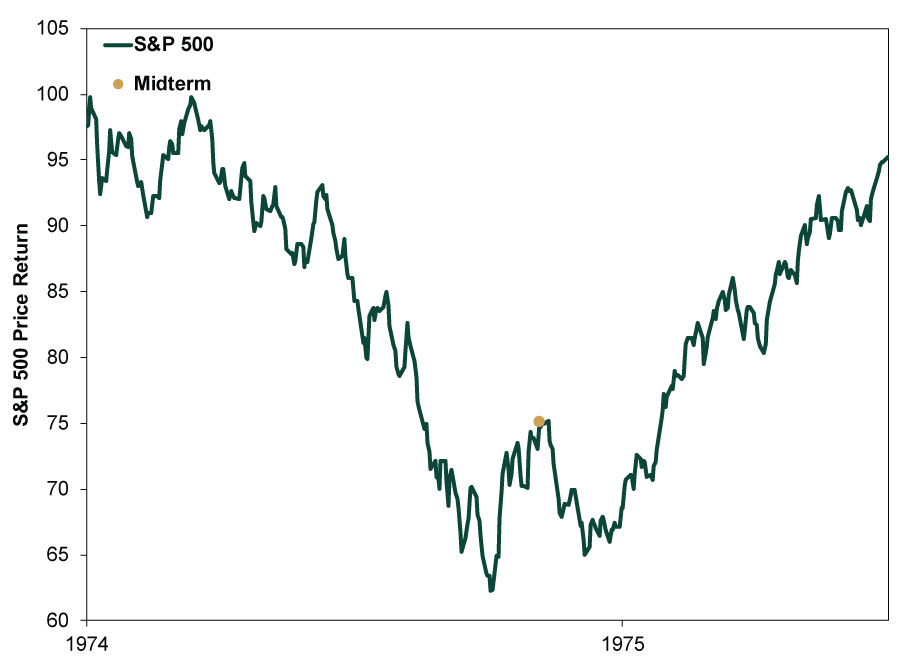
Source: FactSet, as of 10/30/2018. S&P 500 price index level, 1/1/1974 – 6/30/1975.
Exhibit 5: 1978 – 1979
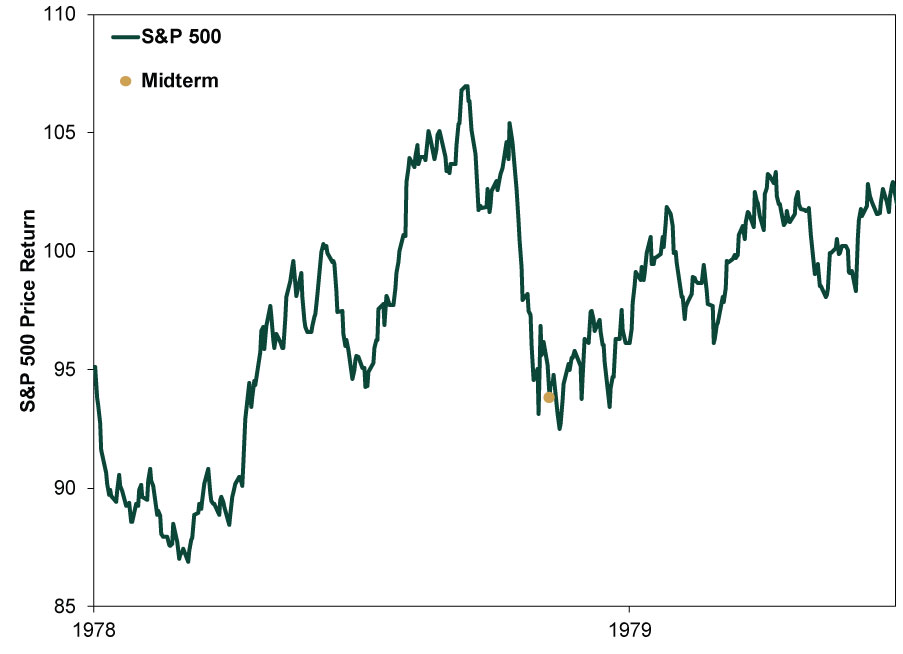
Source: FactSet, as of 10/30/2018. S&P 500 price index level, 1/2/1978 – 6/29/1979.
Exhibit 6: 1982 – 1983
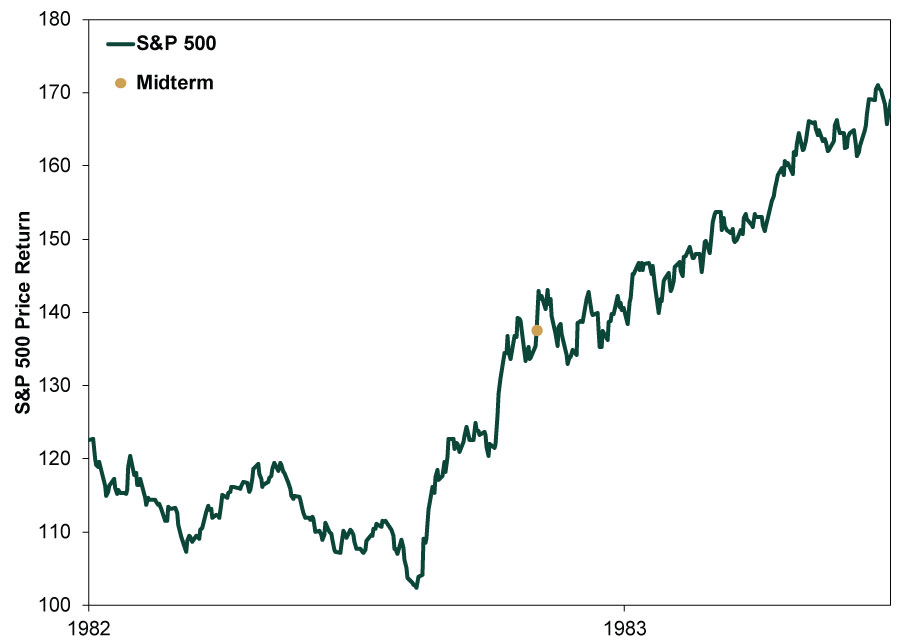
Source: FactSet, as of 10/30/2018. S&P 500 price index level, 1/1/1982 – 6/30/1983.
Exhibit 7: 1986 – 1987
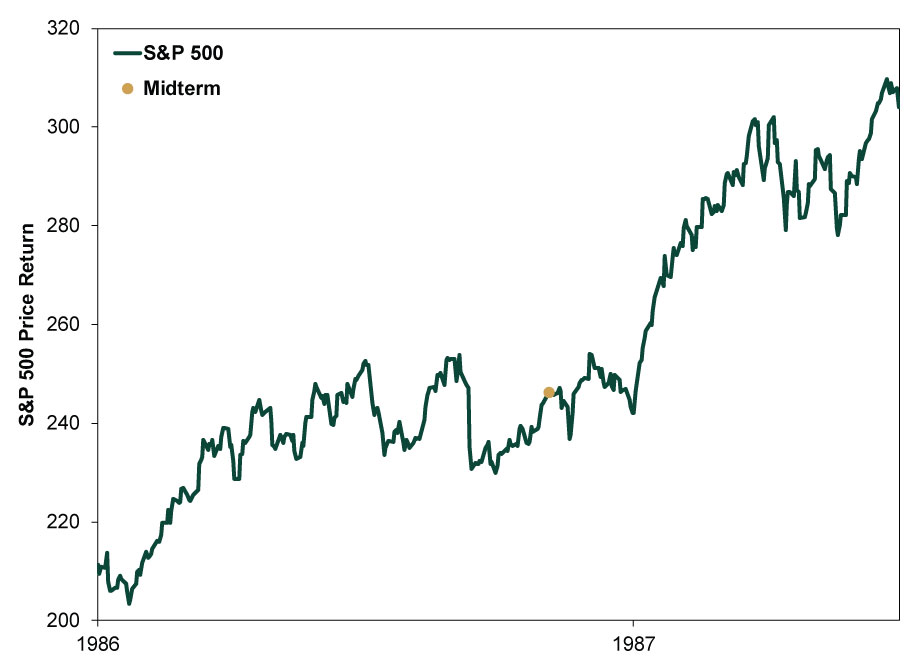
Source: FactSet, as of 10/30/2018. S&P 500 price index level, 1/1/1986 – 6/30/1987.
Exhibit 8: 1990 – 1991
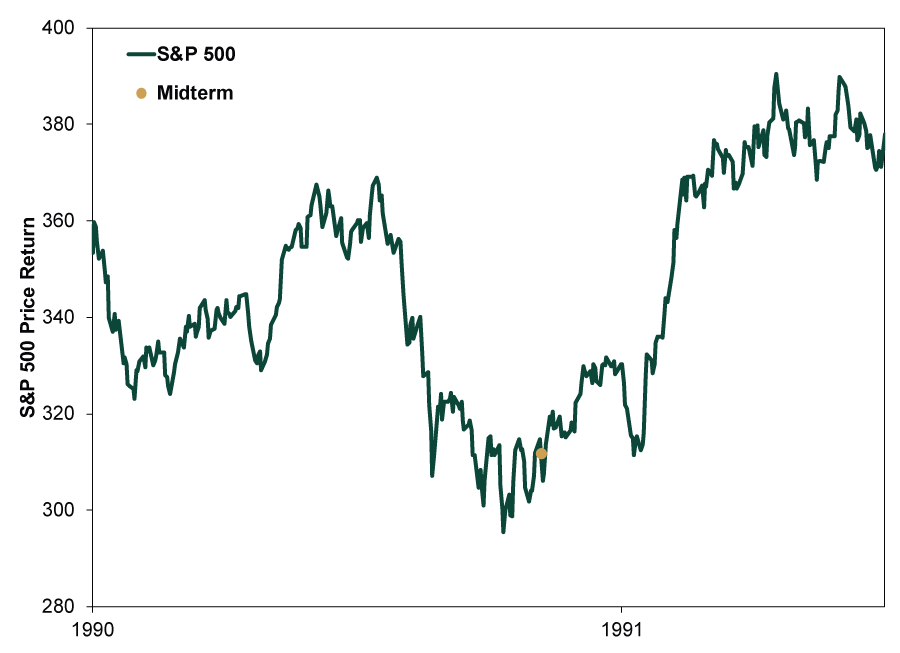
Source: FactSet, as of 10/30/2018. S&P 500 price index level, 1/1/1990 – 6/29/1991.
Exhibit 9: 1994 – 1995
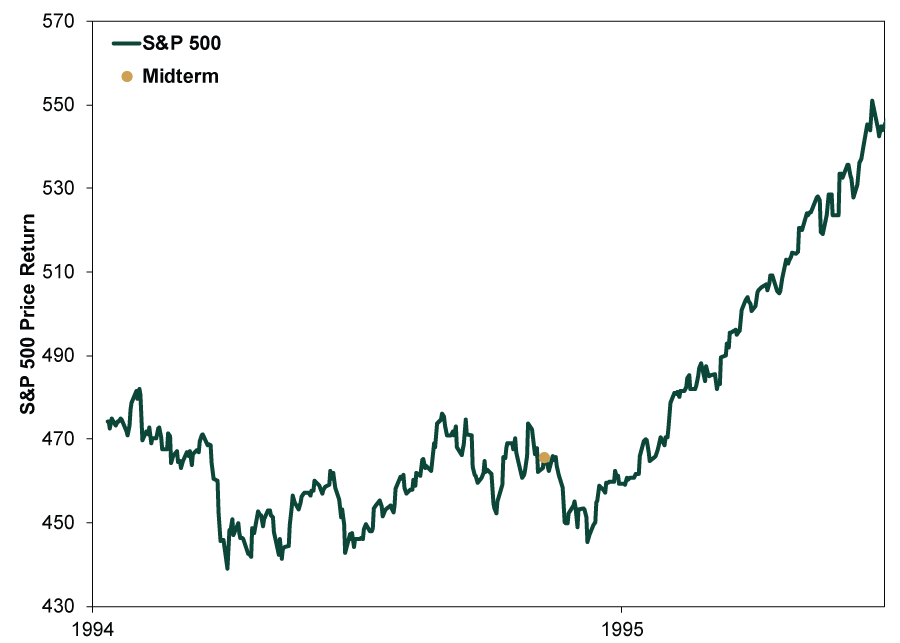
Source: FactSet, as of 10/30/2018. S&P 500 price index level, 1/3/1994 – 6/30/1995.
Exhibit 10: 1998 – 1999
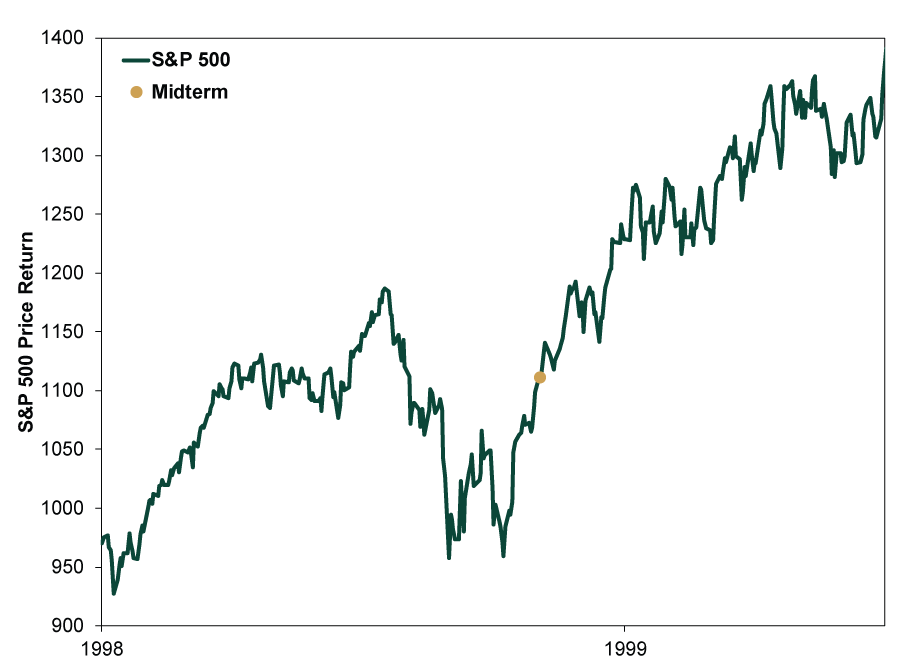
Source: FactSet, as of 10/30/2018. S&P 500 price index level, 1/1/1998 – 6/30/1999.
Exhibit 11: 2002 – 2003
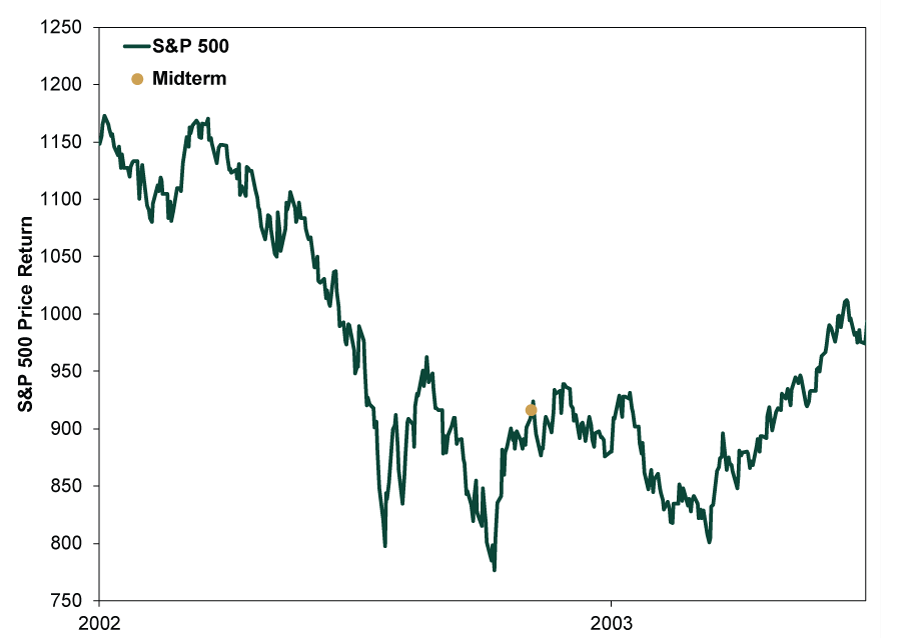
Source: FactSet, as of 10/30/2018. S&P 500 price index level, 1/1/2002 – 6/30/2003.
Exhibit 12: 2006 – 2007

Source: FactSet, as of 10/30/2018. S&P 500 price index level, 1/2/2006 – 7/2/2007.
Exhibit 13: 2010 – 2011
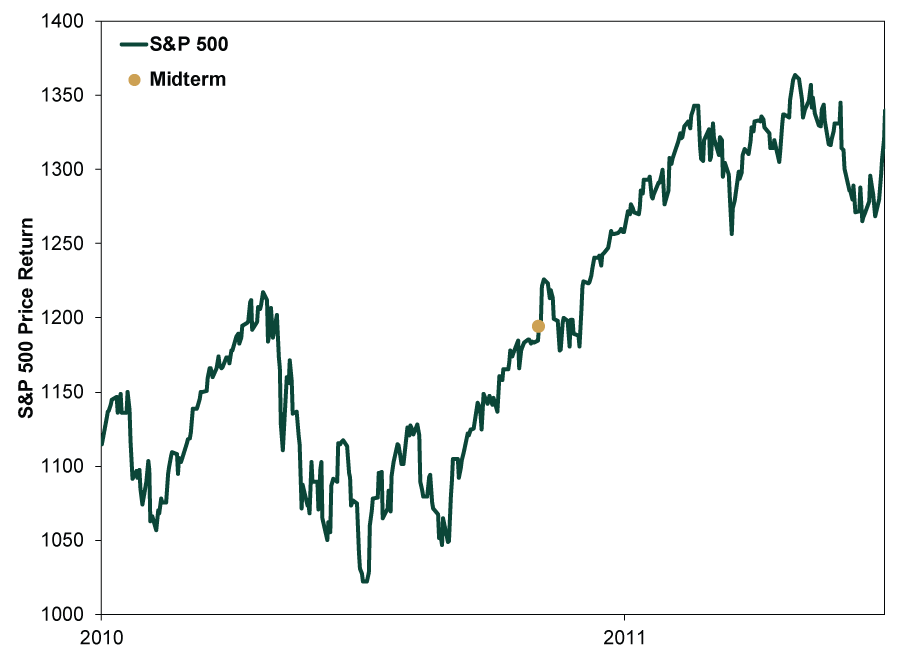
Source: FactSet, as of 10/30/2018. S&P 500 price index level, 1/1/2010 – 6/30/2011.
Exhibit 14: 2014 – 2015
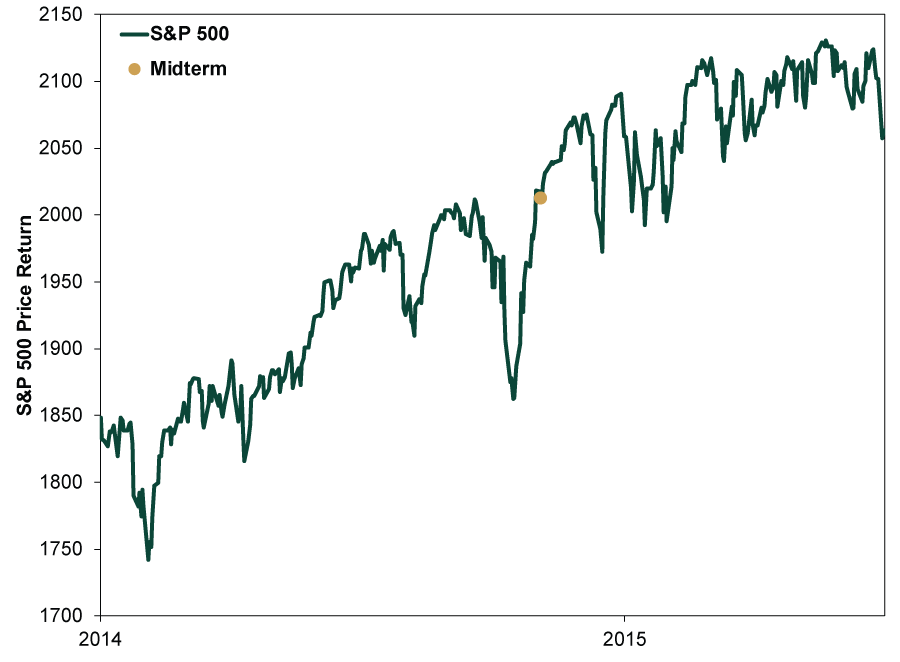
Source: FactSet, as of 10/30/2018. S&P 500 price index level, 1/1/2014 – 6/29/2015.
Exhibit 15: 2018 – 2019 (Through 10/30/2018)
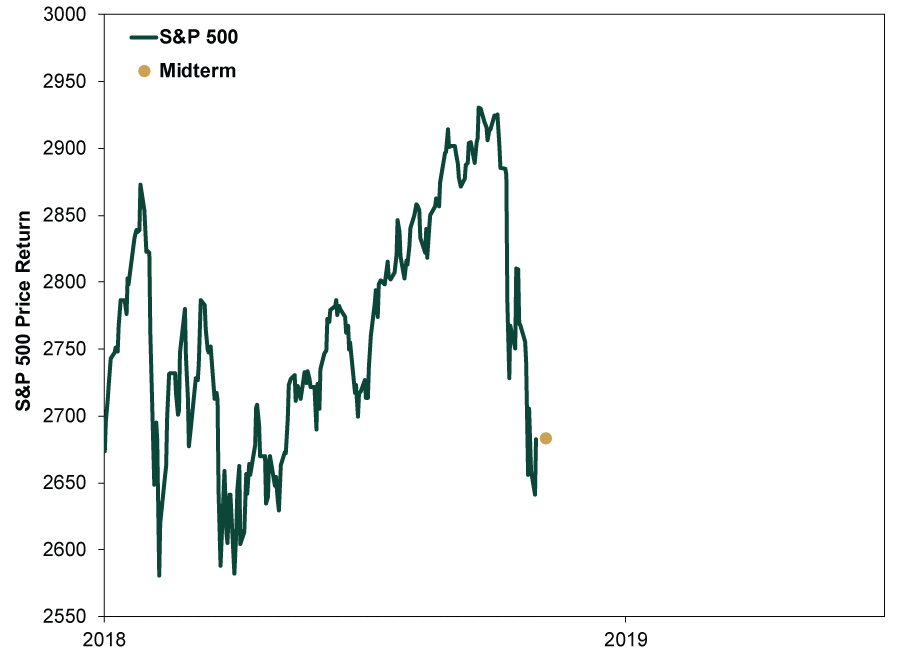
Source: FactSet, as of 10/31/2018. S&P 500 price index level, 1/1/2018 – 10/30/2018.
Keep in mind, too: For those claiming the midterm miracle won’t hold this year because of wrinkles like tariffs, geopolitical tensions and more, these examples cover a range of incidents including many of their own oddities. 1962, for example, came amid the Cuban Missile Crisis. 1998? The Russian ruble crisis and Asia’s regional recession. So while recent market weakness hasn’t been fun, market weakness going into the midterm election is common—not necessarily a sign this year will buck midterms’ bullish history. The relative regularity of pre-midterm market weakness followed by post-midterm market strength should give anyone pause about projecting recent market downside far into the future.[i] Source: Global Financial Data, Inc., as of 9/20/2018. S&P 500 total return index quarterly frequency of positivity, 1926 – 2017.
[ii] Source: FactSet, as of 11/1/2018. S&P 500 total return, 9/30/2018 – 10/31/2018.
[iii] Source: Global Financial Data, Inc., as of 10/18/2018. S&P 500 monthly total return, January 1926 – June 2014.
If you would like to contact the editors responsible for this article, please message MarketMinder directly.
*The content contained in this article represents only the opinions and viewpoints of the Fisher Investments editorial staff.
Get a weekly roundup of our market insights
Sign up for our weekly e-mail newsletter.

You Imagine Your Future. We Help You Get There.
Are you ready to start your journey to a better financial future?

Where Might the Market Go Next?
Confidently tackle the market’s ups and downs with independent research and analysis that tells you where we think stocks are headed—and why.
Related Resources
-
Market Analysis Pumping Up the Yen?2026-07-17
-
Market Analysis Business Friendly Bureaucracy or No, Britain is Growing2026-07-16
-
Economics Don’t Doubt the Old World2026-07-16
-
Market Analysis On the June Inflation Cooldown2026-07-14


Learn More
Learn why 210,000 clients trust us to manage their money and how Fisher Investments and its affiliates may be able to help you achieve your financial goals.
As of 6/30/2026
New to Fisher? Call Us.
Contact Us Today